Chiliz (CHZ/USD) Momentum Weakens as Price Sinks Below Range Support
Estimated Reading Time: 2 minutes
Don’t invest unless you’re prepared to lose all the money you invest. This is a high-risk investment and you are unlikely to be protected if something goes wrong. Take 2 minutes to learn more

Price Analysis: CHZUSD Bearish Momentum Builds
Chiliz continues its steady retreat, now trading near $0.0271, marking a –5.90% slide for the session. The token has cleanly broken below the $0.0306 support level, a zone that had previously cushioned price action several times this year.
CHZUSD Key Levels:
Resistance Levels: $0.0306, $0.0379
Support Levels: $0.0203, $0.01960

The breach turns that level into fresh resistance, exposing downside risk toward the $0.0203 base a price not seen since early 2023. The DMI (Directional Movement Index) metrics paint a distinctly bearish picture. The –DI line dominates strongly over +DI line, underscoring persistent selling pressure
ADX (Average Directional Index) is notably elevated, confirming that this is a well-defined trend, not a temporary dip. When ADX (Average Directional Index) exceeds 40 alongside strong negative DMI alignment, it typically signals mature bearish control.
CHZUSD is no longer consolidating, it’s trending downward with conviction. Unless CHZ recovers and closes back above $0.0306, the dominant technical structure favors continued drift toward $0.025 and potentially $0.020.

Market Expectation
On the 4‑hour timeframe, short‑term indicators echo the daily chart’s bearish tone but suggest the trend may be entering a pause phase. -DI continues to lead +DI, reinforcing downside bias. The ADX has flattened, indicating that while the trend remains intact, its strength may be stabilizing
Price action shows a methodical descent small-bodied candles, low volatility, and no panic. This controlled drift suggests that sellers are in charge, but not accelerating. Momentum may cool near the $0.026–$0.025 pivot zone, where previous intraday supports provided temporary relief.
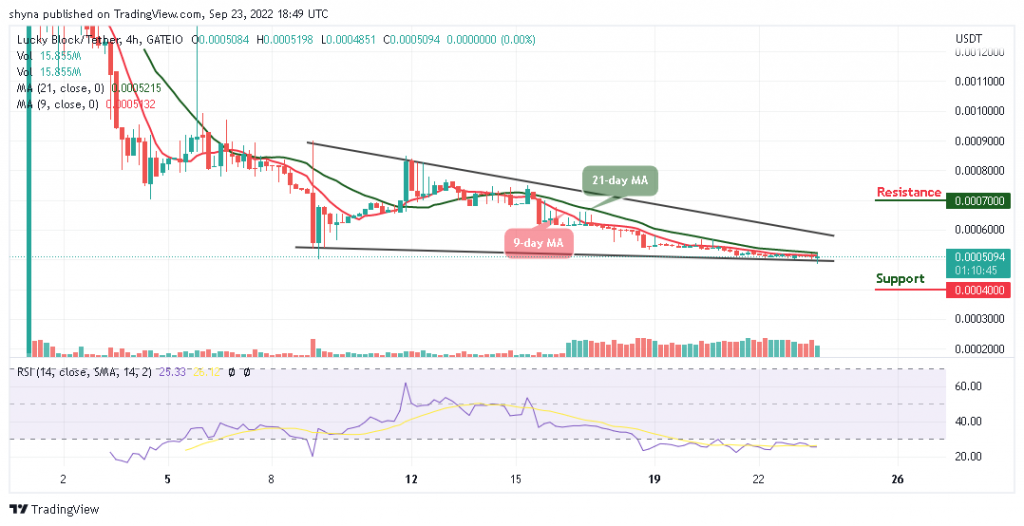
You can purchase Lucky Block here. Buy LBLOCK
Note: Cryptosignals.org is not a financial advisor. Do your research before investing your funds in any financial asset or presented product or event. We are not responsible for your investing results