D2TUSD Price Forecast: Price Under Pressure Above $0.00518 High
Estimated Reading Time: 3 minutes
Don’t invest unless you’re prepared to lose all the money you invest. This is a high-risk investment and you are unlikely to be protected if something goes wrong. Take 2 minutes to learn more

Dash 2 Trade Price Forecast: D2TUSD Price Remains Pressured above the $0.00518 High Value (January 1)
Dash 2 Trade is back in the green again as the price remains pressured above the $0.00518 high value. The coin is currently attempting to avoid falling by resisting sellers; however, if the bulls’ pressure breaks through the resistance level of $0.00712, the coin price may rise further to a $0.01000 high trend line, which would represent a significant turnaround for coin holders.
Key Levels:
Resistance levels: $0.00800, $0.00900, $0.01000
Support levels: $0.00500, $0.00400, $0.00300
D2T (USD) Long-term Trend: Bullish (4H)
The long-term market value of Dash 2 Trade is moving in a bullish direction. This is clear as we can see the prices trading above the EMA-9 approaching the overhead resistance which indicates an uptrend.
The pressure from long-term traders to a $0.00539 high value in the past session adds to the bullish impact on the market.
The 4-hourly bullish candle at the $0.00540 supply value above the EMA-9 today confirms the bulls’ dominance in the market. This breakup has the potential to accelerate the bullish momentum and extend the current correction to a higher level.
Further, an increase in the buying pressure might lead the price of Dash 2 Trade to retest the previous high of $0.00712 high mark, obtaining a higher footing to rise higher.
In addition, the D2TUSD pair however shows the continuation of bullish sentiment by pointing up on the daily stochastic while the coin price remains pressured above the $0.00518 high value.
As a result, the downside risk remained uncertain. Thus, the next bulls’ target might be the $0.01000 high level in the days ahead in its long-term outlook.
D2T (USD) Medium-term Trend: Bullish (1H)
The momentum on the higher timeframes (1H) is starting to turn undeniably bullish. The lack of a bearish continuation is also distinctly seen from the chart.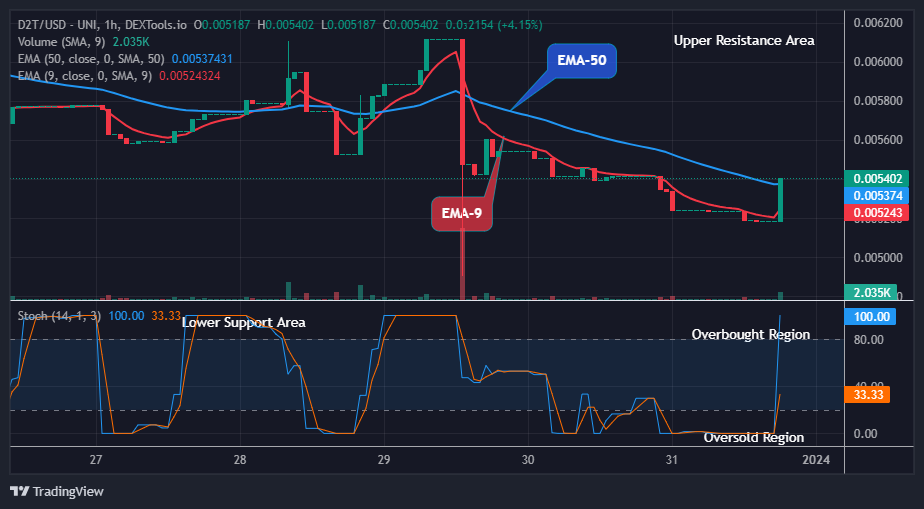
As an outcome of low bearish momentum, buyers are hindering the market from smashing through the support zones.
The coin price at a $0.00540 high value is undeniably bullish as the 1-hour session opens today. Thus, buyers must redouble their efforts to forecast a bullish increase in the market above the $0.00611 supply mark.
Notably, the Dash 2 Trade price may likely continue in the same bullish trend as the market is pointing up, indicating an uptrend on the daily stochastic. So, the price could be ready very soon for a bullish pattern continuation. In this case, a significant level above the $0.01000 supply trend line might be the target soon in its medium-term time frame.
D2T’s 2023 Year in Review: Critical Infrastructure and Exciting New Features.
D2T’s 2023 Year-in-Review: Essential Infrastructure and Powerful New Features
— Dash 2 Trade (@dash2_trade) December 29, 2023
Hey Traders!
With the New Year and all the expected features and updates in Q1 of 2024 almost here, we wanted to take a moment to look back and reflect on the many development successes and… pic.twitter.com/NVCty04wiE
Want a coin that has a huge potential for massive returns? That coin is Dash 2 Trade. Buy D2T now.