Dogecoin (DOGE) Price Prediction: DOGE/USDT Keeps Hovering Just Above $0.1400
Estimated Reading Time: 3 minutes
Don’t invest unless you’re prepared to lose all the money you invest. This is a high-risk investment and you are unlikely to be protected if something goes wrong. Take 2 minutes to learn more

Date: December 9, 2025
The Dogecoin market hasn’t been seeing much of a bullish catalyst of late. In fact, price action in this market has spiraled downward for an extended period. Nevertheless, the $0.1400 price level has presented what seems like a strong baseline, as price action hasn’t been able to descend below it.
DOGE/USDT Long-Term Trend — Bearish (Daily Chart)
Key Price Levels:
Resistance: $0.1500, $0.1750, $0.2200
Support: $0.1400, $0.1200, $0.1000
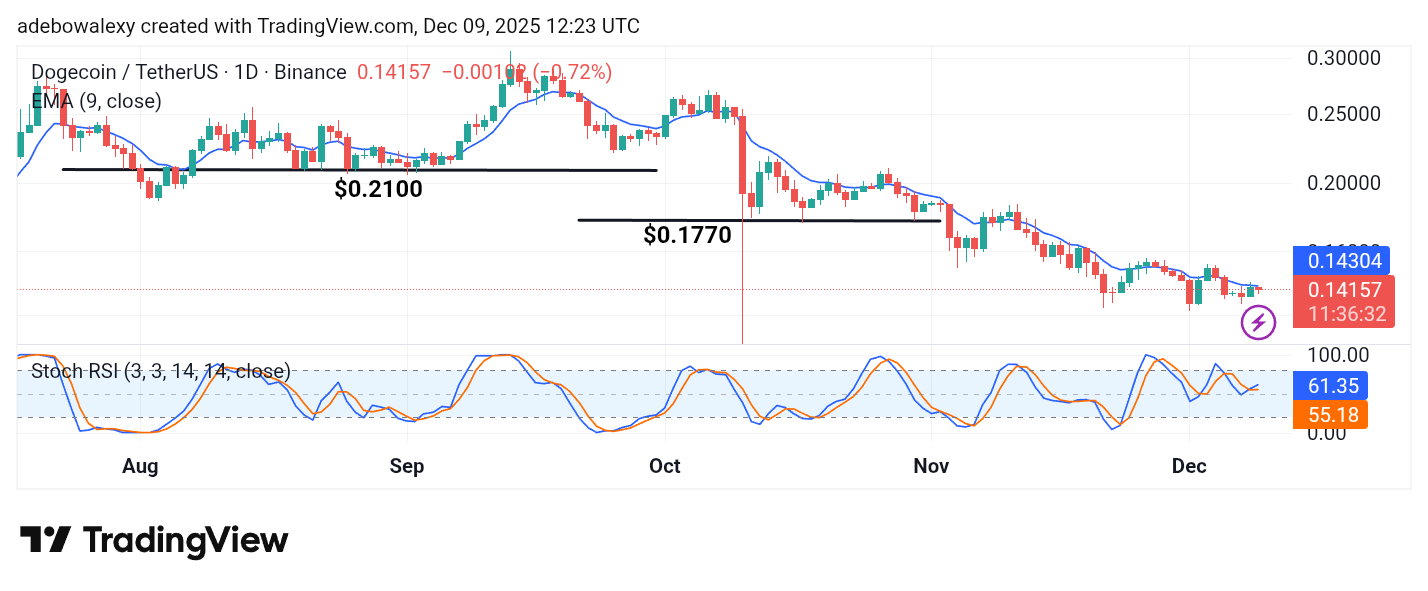
Price action in the Dogecoin market has been hovering below the 9-day Exponential Moving Average (EMA) curve for a while. Also, the current session has appeared as a red price candle as it tests the 9-day EMA. Likewise, the Stochastic Relative Strength Index (SRSI) indicator has delivered an upward crossover, but the resulting line isn’t rising sharply. The latest price candle on this chart only keeps the token trading above the open of the previous session.
Dogecoin (DOGE) Price Prediction: DOGE/USDT Stays Within Range of Breaching the $0.1400 Mark
The Dogecoin market remains in bearish territory. As such, the price of the token may soon continue descending further below the 9-day EMA curve. The last price candle on the chart is already a bearish one and hints at growing bearish influence.
Although the SRSI indicator lines have delivered an upside crossover, their current movement suggests that bears are still largely dominant in this market. Therefore, long traders may still want to exercise patience before entering.
Dogecoin (DOGE) Price Prediction: DOGE/USDT Needs More Catalyst (4-Hour Chart)
On the 4-hour chart, price action remains below key technical levels. This persists despite the ongoing session printing a green candle. The corresponding price candle remains below the 9-day EMA curve, though it is currently testing it from below.
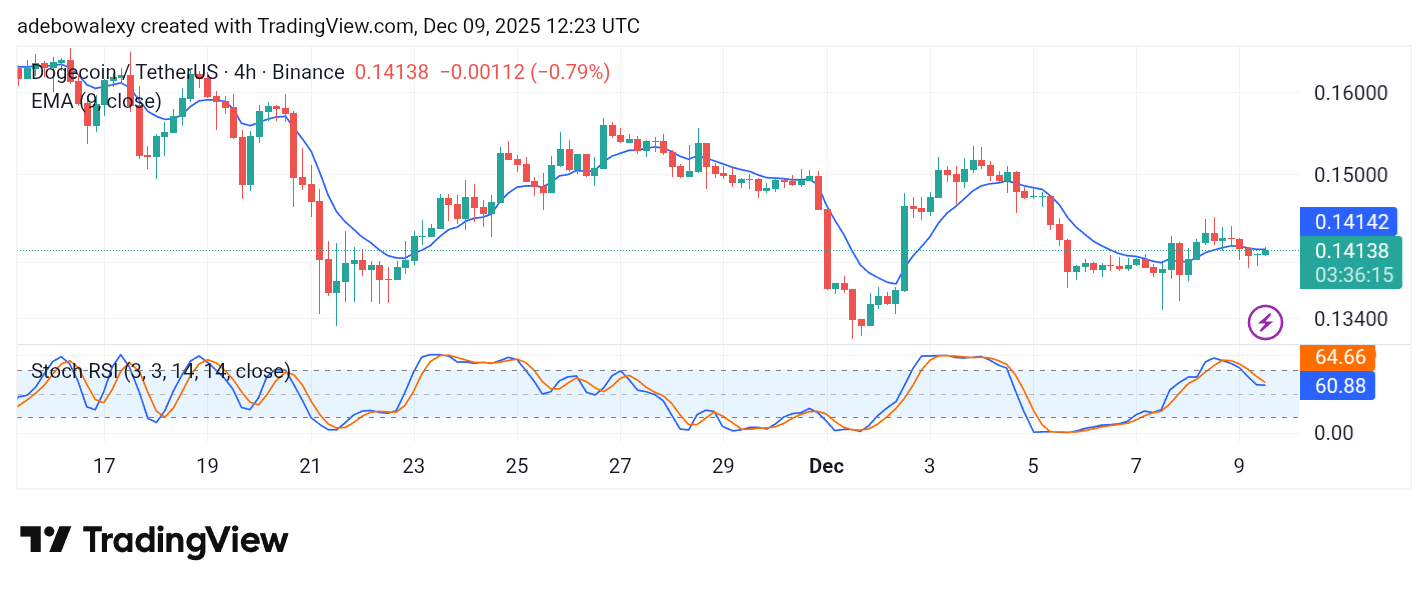
The lines of the SRSI indicator can be seen taking on a general downward bearing. The terminals of the SRSI are leaning toward a crossover, which indicates an impending trend shift. Therefore, although it appears price action may soon rise past the 9-day EMA, bullish traders may want to wait until that occurs before targeting price levels above $0.1500.