Dogecoin (DOGE) Price Prediction: DOGE/USDT Sees a Moderate Pullback Below Key Levels
Estimated Reading Time: 3 minutes
Don’t invest unless you’re prepared to lose all the money you invest. This is a high-risk investment and you are unlikely to be protected if something goes wrong. Take 2 minutes to learn more

Date: June 9, 2025
The Dogecoin market has been under some pressure lately. Consequently, price action has been hovering around important technical levels. More recently, the market has fallen below a key level, which may signal further short-term downward retracements.
DOGE/USDT Long-Term Trend: Bearish (Daily Chart)
Key Price Levels:
Resistance: $0.2100, $0.2600, $0.3000
Support: $0.1800, $0.1600, $0.1100
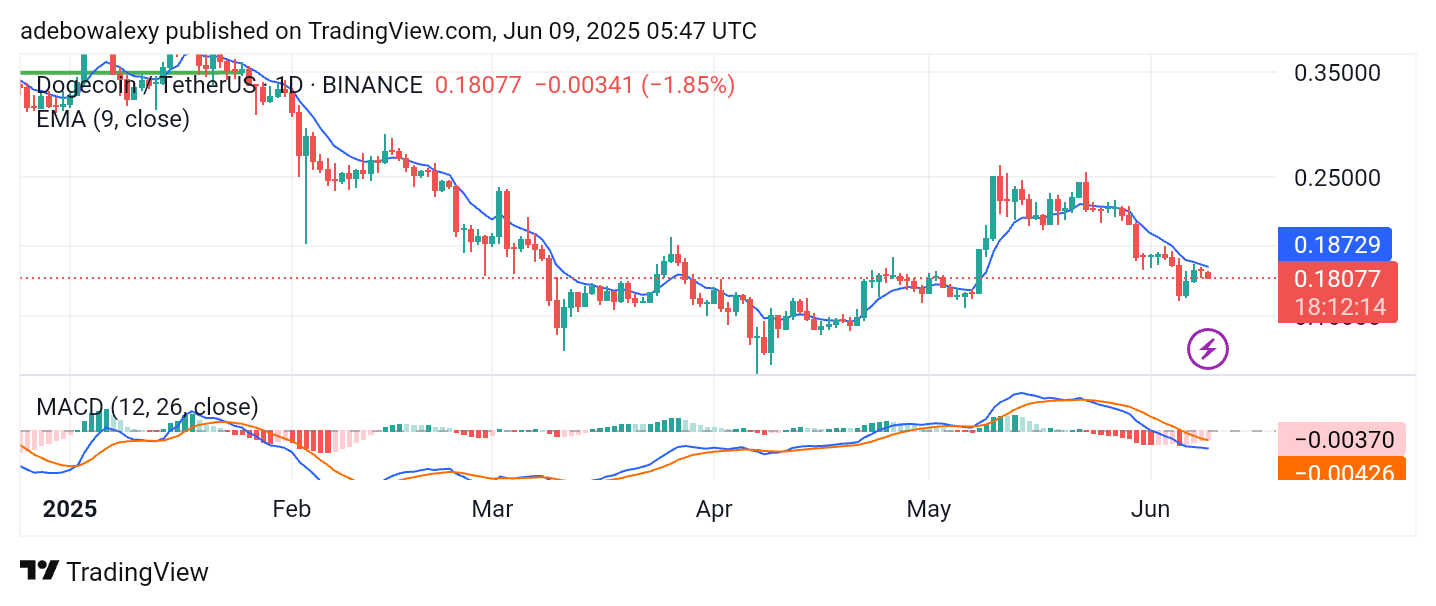
For the past seventeen sessions, price activity in the Dogecoin market has been trading below the 9-day Exponential Moving Average (EMA) line. Since then, the market has generally been retracing toward lower price levels. Likewise, the Moving Average Convergence Divergence (MACD) indicator lines have fallen below the equilibrium level. However, the histogram bars of this indicator are now pale red below the equilibrium level. Similarly, the indicator lines seem to be drawing closer to each other while maintaining a downward trajectory.
Dogecoin (DOGE) Price Prediction: DOGE/USDT Has Downside Potential
As mentioned above, price action in the Dogecoin market has remained below key technical levels. Specifically, price activity has been dwelling beneath the resistance posed by the 9-day EMA line.
As a result, the ongoing session appears bearish and remains below the 9-day EMA curve. Similarly, the MACD lines are still below the equilibrium level. Although the histogram bars are now pale red, the indicator line maintains a downward trajectory. Consequently, downward forces still seem likely to cause further retracements.
Dogecoin (DOGE) Price Prediction: DOGE/USDT Bearish Prospect Stays Intac
Price activity in the Dogecoin 4-hour chart shows characteristics similar to those of the daily chart. The most recently formed price candle remains below the 9-day EMA line. In fact, for the most part, price activity has seen a clear break below the 9-day EMA.
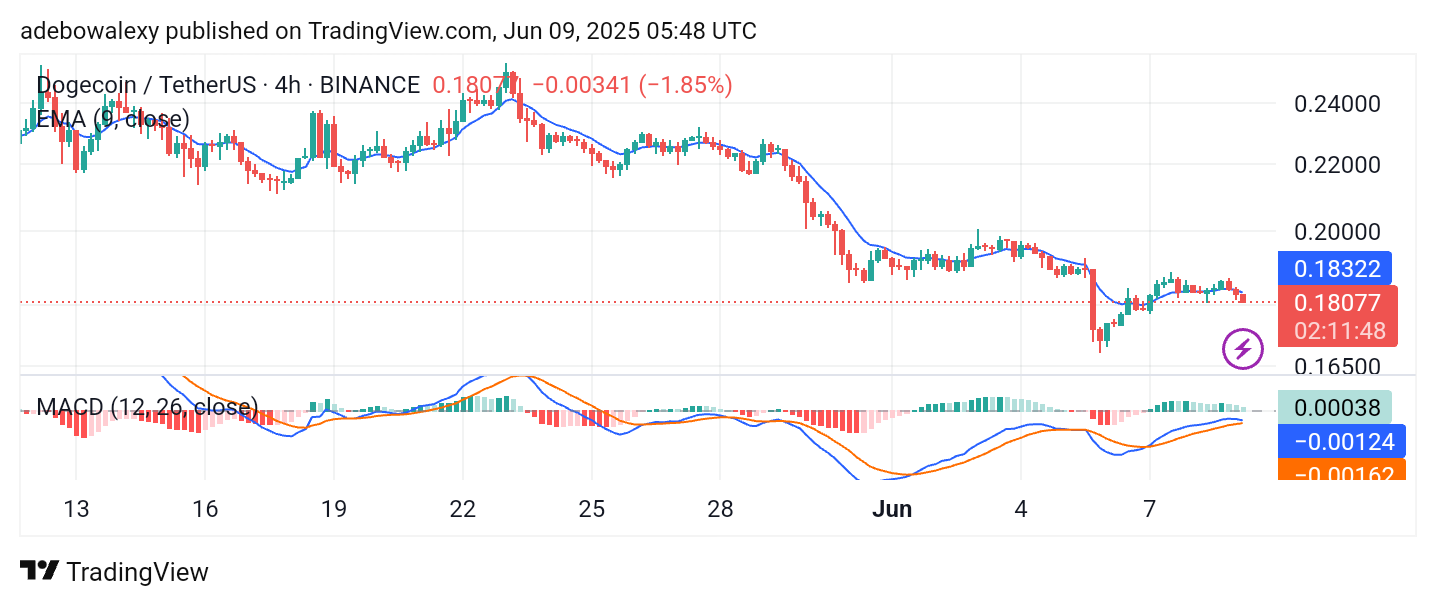
The recent price candles are bearish but small, suggesting limited price movement. Additionally, the MACD indicator lines appear to be taking a new downward path, with its histogram bars now appearing solid red. Therefore, traders might consider taking short-term bearish positions toward the $0.1750 price level.