EigenLayer (EIGEN/USDT) Eyes Potential Upside Rebound at $4.555
Estimated Reading Time: 3 minutes
Don’t invest unless you’re prepared to lose all the money you invest. This is a high-risk investment and you are unlikely to be protected if something goes wrong. Take 2 minutes to learn more

The general market sentiment for Eigenlayer against the Tether has been bullish recently. The price has gradually increased since mid-November, as indicated in the formation of higher highs, which are sometimes occasioned by short consolidation periods. However, the formation of a bearish candlestick suggests waning momentum.
Recently, the price action below the shorter EMAs suggests the pair is on a short-term correction after facing strong resistance at $4.62; this shows that EIGEN/USDT is losing momentum, and the price might experience a dip to $4.328. However, the positioning of the Stochastic RSI indicates the current condition may be a short-term pullback, and a potential upside reversal might occur soon.
Currently, Eigen/USDT trades at $4.452, and it is down by 2.67% compared to the previous session.
Technical Indicators
Major Resistance Levels: $4.555, $4.620, and $4.700
Major Support Levels: $4.278, $4.183, and $4.095
EigenLayer Technical Analysis
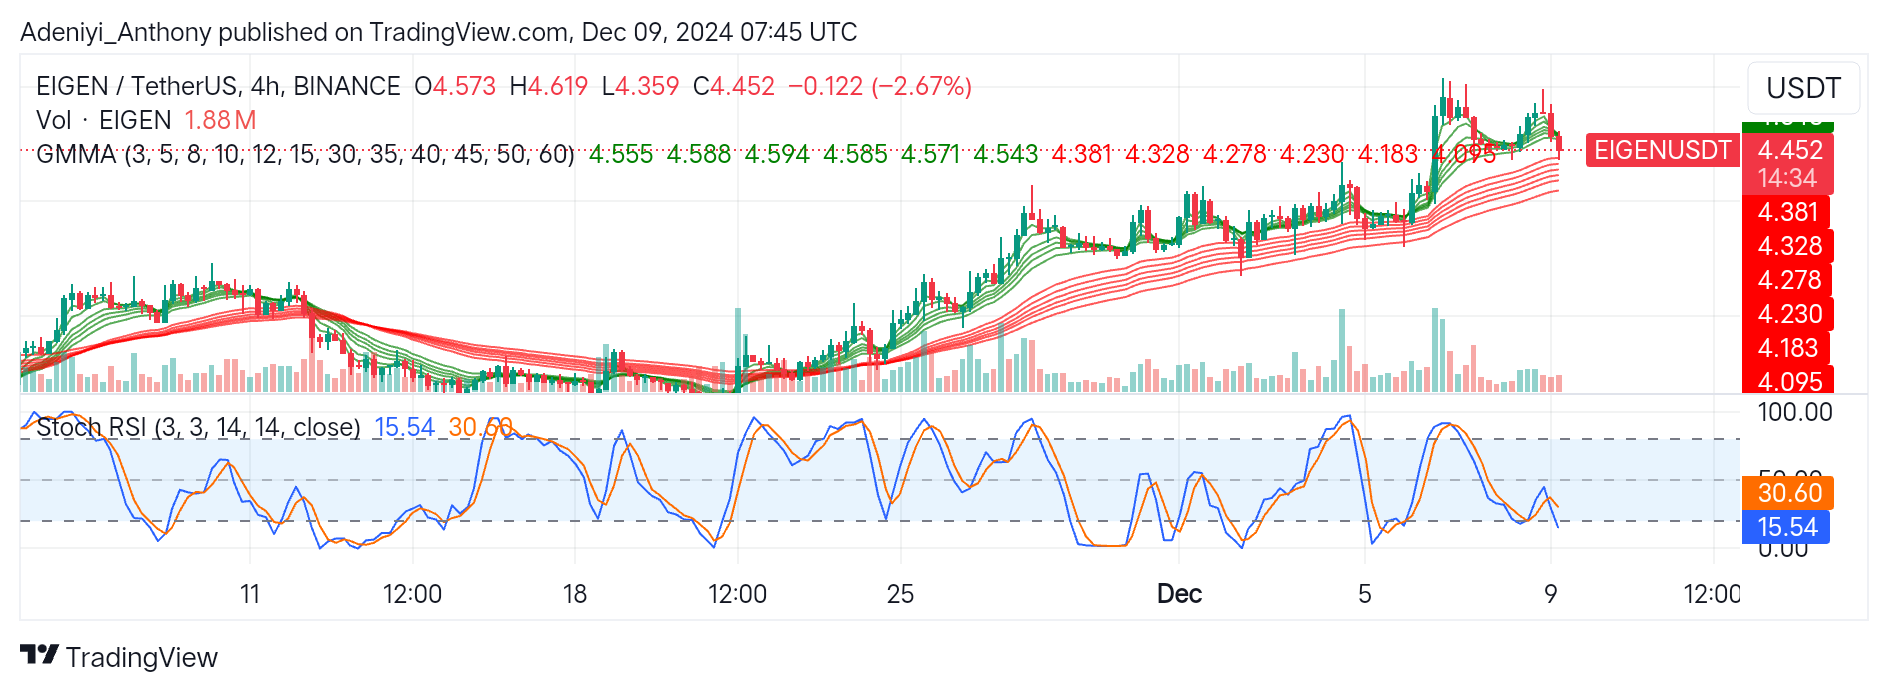
The analysis of EigenLayer against the Tether on a 4H chart shows that the pair is currently on a short-term downtrend after facing strong resistance at $4.620. Though there is no significant breakout in view, the gap between the Guppy Multiple Moving Averages (GMMAs) is still visible.
Therefore, the recent pullback to the $4.452 level could serve as a potential support level for another upward breakout, provided the price consolidates or bounces back at that level. However, if the price fails to hold at this level, further downside may occur.
On the other hand, the Stochastic oscillator shows the pair is currently operating in the oversold region with the lines pointing to the south. However, this suggests the EIGEN/USDT is under strong selling pressure with a moderate trading volume; it may also indicate a waning selling pressure. To this end, a break below $4.278 may signal the start of a bearish reversal; otherwise, a break above the $4.555 level would indicate the continuation of a bullish movement.
EIGEN/USDT Analysis: A Continued Downtrend or a Correction to the North?
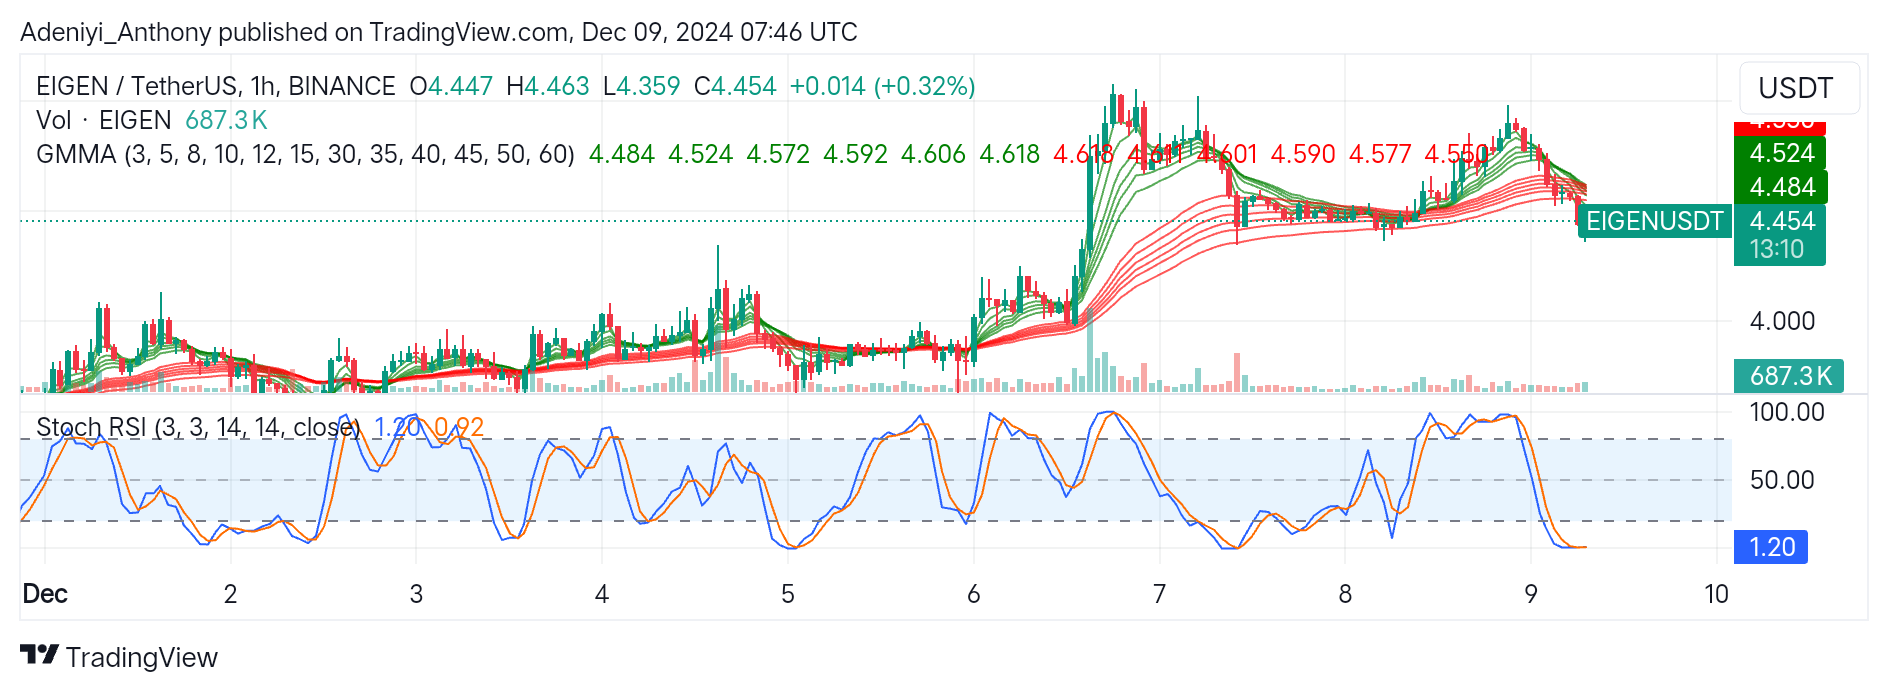
The analysis of the EIGEN/USDT on a 1H timeframe shows that the pair is experiencing a correction after reaching a recent high near $4.620. The convergence of the GMMAs indicates a reduced bullish momentum, which may suggest a further downtrend if the immediate support level is not strong enough.
The Stochastic RSI on the other hand is extremely oversold, indicating that selling pressure may be exhausted and a short-term reversal could be imminent.
Therefore, for an upside breakout, the price must close above $4.555; otherwise, the pair may see a further downtrend if it fails to close above $4.400.
You can purchase crypto coins here. Buy LBlock