Eigenlayer (EIGEN/USDT) Faces Bearish Pressure Amidst Key Levels
Estimated Reading Time: 3 minutes
Don’t invest unless you’re prepared to lose all the money you invest. This is a high-risk investment and you are unlikely to be protected if something goes wrong. Take 2 minutes to learn more

The market for EigenLayer against the Tether in recent times has shown significant bearish momentum, closing at $1.502 after reaching a high of $1.561 during this session, recording a decline of 3.99%. This follows a period where price failed to sustain above the psychological $1.600 level, suggesting a weakened bullish conviction.
As it stands, the current price sits between the Bollinger Band lower boundary at $1.146 and the mid-level at $1.259. To this end, this indicates a potential oversold condition but within a broader downtrend, as the Stochastic RSI shows a mixed signal.
Currently, EigenLayer trades at $1.502, recording over 4 million traded volumes for the day.
Technical Indicators
Major Resistance Levels: $1.561, $1.600, and $1.720
Major Support Levels: $1.484, $1.466, and $1.259
EigenLayer Technical Analysis
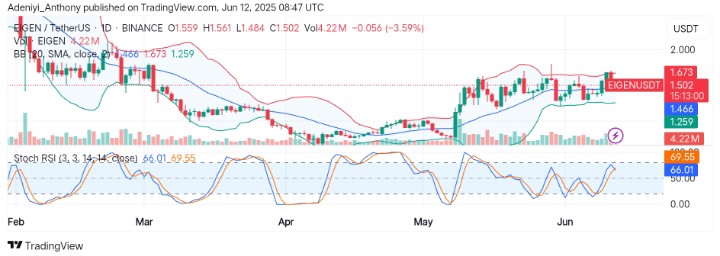
The analysis of EigenLayer against the Tether on the weekly timeframe shows the pair is in a corrective phase after failing to claim the $1.600 level. However, the expansion of the Bollinger Bands suggests impending increasing volatility, while the neutrality of the Stochastic RSI indicates a lack of decision among the market participants.
From another angle, the volume during the decline is not exceptionally high, suggesting the move lacks strong conviction, which could be a result of sellers’ exhaustion or buyers’ reluctance.
To this end, if the pair’s price holds above the current level, a move above $1.600 in the near term. Conversely, a breakdown below $1.484 would indicate a bearish trend continuation.
EIGEN/USDT Analysis: Where from Here?
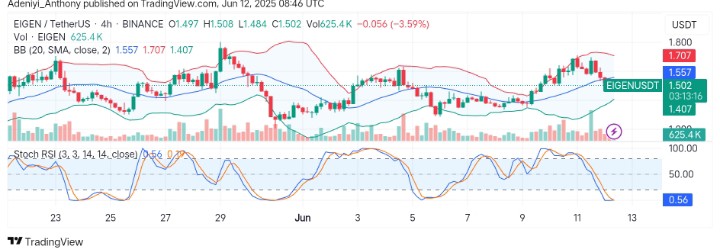
On the 4H chart, EIGEN/USDT appears to be struggling below the dynamic line of the Bollinger band, with the price operating within a tight range of $1.508 and $1.484, reflecting consolidation after a decline with a flat-out Stochastic RSI in the oversold region.
From another angle, the volume in this timeframe suggests a weakening selling momentum as the momentum oscillator prepares for a bullish crossover in the oversold region.
To this end, the pair may see some improvement to the north if momentum holds above the current level; otherwise, a break below the $1.466 level will signal trend continuation as the band is expected to expand soon.
You can purchase crypto coins here. Buy LBlock