Ethereum Breaks Resistance at $2,600 but the Uptrend Is Stuck at $2,800
Estimated Reading Time: 2 minutes
Don’t invest unless you’re prepared to lose all the money you invest. This is a high-risk investment and you are unlikely to be protected if something goes wrong. Take 2 minutes to learn more

Free Crypto Signals Channel

Ethereum Price Long-Term Analysis: Bearish
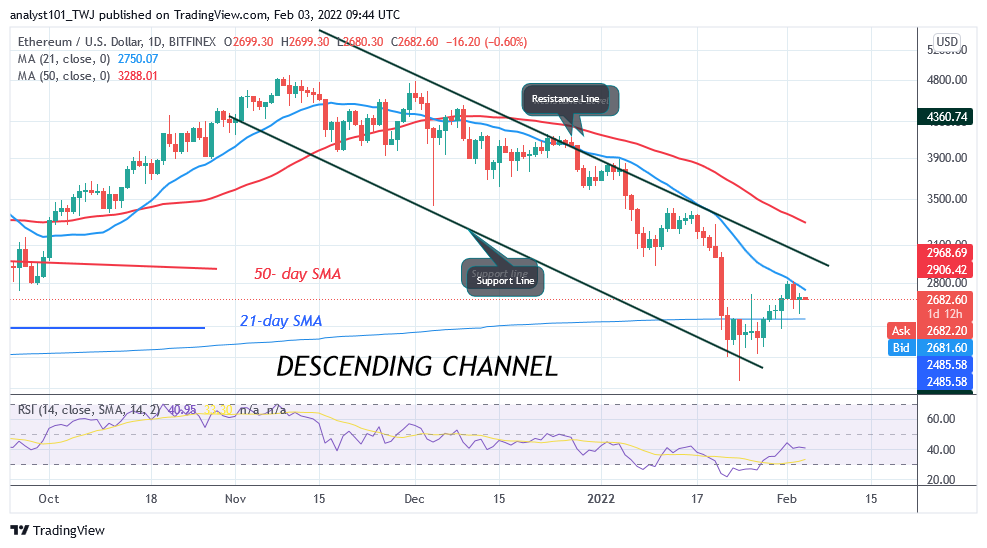
Ethereum’s (ETH) price was earlier in a downward correction but the uptrend is stuck at $2,800. However, on January 31, the bulls broke above the resistance line of the horizontal channel to reach a high of $2,800. Today, Ether has retraced to $2667 support as the altcoin prepares for another rally. On the upside, If the bulls break above the $2,800 resistance, the largest altcoin will rally to $3,450. However, if the bullish scenario is invalidated, ETH/USD will fall and resume a downward correction
Ethereum Indicator Analysis
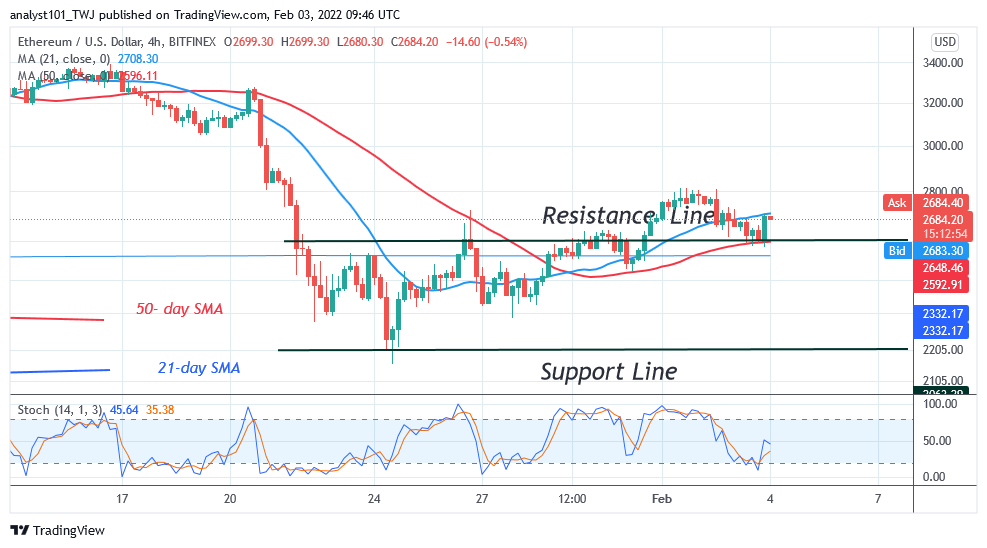
The cryptocurrency has risen to level 42 of the Relative Strength Index for period 14. The largest altcoin is in the downtrend zone and capable of falling to the downside. Ether is above the 30% range of the daily stochastic. ETH/USD price is in a bullish momentum. The 21-day SMA and 50-day SMA are sloping southward indicating the downtrend.
Technical indicators:
Major Resistance Levels – $2, 600, $2,800, $3,000
Major Support Levels – $1.500, $1, 300, $1,100
What Is the Next Direction for Ethereum?
Ethereum is in a downward correction as the market corrects upward but the uptrend is stuck at $2,800. The biggest altcoin’s range-bound move between $2,205 and $2,600 has been broken as Ether prepares for a further upward move. The upward move is facing resistance at level $2,700 high.
You can crypto coins here. Buy Tokens
Note: Cryptosignals.org is not a financial advisor. Do your research before investing your funds in any financial asset or presented product or event. We are not responsible for your investing results