Ethereum (ETH/USDT) at a Crossroad: Will the Bulls or Bears Prevail?
Estimated Reading Time: 3 minutes
Don’t invest unless you’re prepared to lose all the money you invest. This is a high-risk investment and you are unlikely to be protected if something goes wrong. Take 2 minutes to learn more
Ethereum Long-term Analysis: Ranging
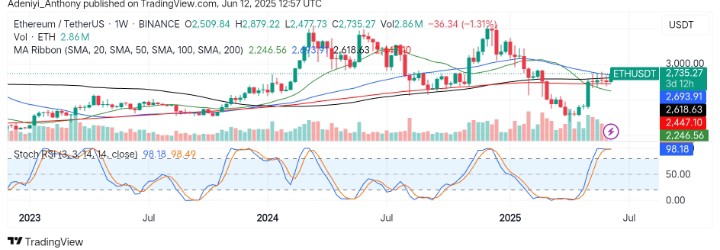
The market for Ethereum against the Tether has been navigating choppy waters recently, with the price currently hovering within the cluster of the moving averages ribbon, reflecting a slight decline of 0.65% from the previous high.
Over the past few days, it has tested higher and lower bounds, reclaiming highs as high as $2,877 and lows as low as $2,477. However, the market appears mixed, as indicated by the Stochastic RSI exhibiting a straight line at the overbought region, while the moving averages suggest potential support below.
Currently, Ethereum trades at $2,735.27, printing 2.86 million traded volumes for the week.
Technical Indicators
Major Resistance Levels: $2,879, $3,000, and $3,500
Major Support Levels: $2,618, $2,447, and $2,247
Ethereum Technical Analysis
The analysis of Ethereum against the Tether finds itself at a critical juncture with the price operating above some of the key moving averages. However, the convergence of the 100 SMA and 200 SMA indicates a potential battleground between the bulls and bears.
On the other hand, the Stochastic RSI nears exhaustion as both lines operate at the extreme overbought range, hinting at a possible pullback before any major move.
To this end, the trading volume in this timeframe shows moderate activities as the price struggles to hold above the $2,800 resistance level.
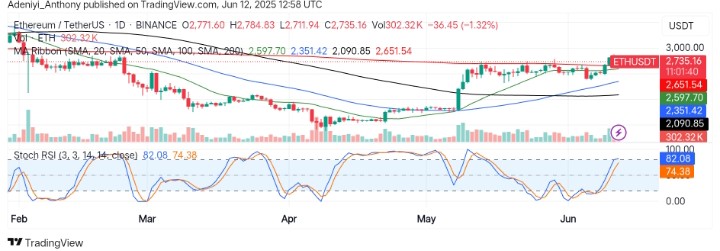
ETH/USDT Analysis: Will the $2,700 Support Hold?
On the daily timeframe, ETH/USDT appears to be showing signs of consolidation with 0.63% from its opening price as the price fluctuates between a close range, reflecting indecision amidst the market participants.
However, the Stochastic RSI hints at an overbought condition while the moving averages serve as strong support for the pair to lean on, while the volume shows no significant spike.
To this end, if the price can hold above the current support at $2,651, the pair may see a move toward $3,000 in the coming terms; otherwise, a pullback beyond $2,618 in the near term may invalidate this move.
You can purchase crypto coins here. Buy LBlock