Ethereum (ETH/USDT) Displays Bullish Continuation Signal Despite Proximity to Key Resistance Level
Estimated Reading Time: 3 minutes
Don’t invest unless you’re prepared to lose all the money you invest. This is a high-risk investment and you are unlikely to be protected if something goes wrong. Take 2 minutes to learn more
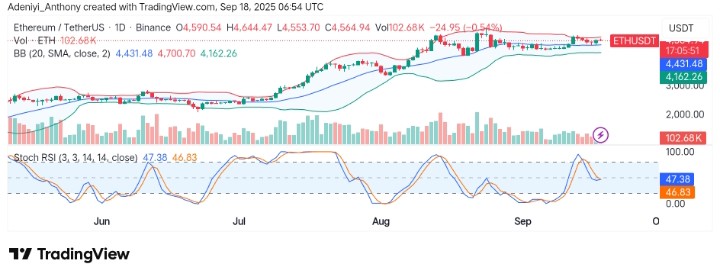
Ethereum against Tether has been exhibiting strong price action recently, rallying up to the north on the shorter timeframe. However, it seems the table is about to turn as the price faces strong resistance. At the moment, the market sentiment is bullish, as ETH continues to trade above the 20-day simple moving average (SMA).
Though the recent rally appears to have momentum, the current outlook of the Stochastic RSI is showing signs of potential exhaustion as the pullback and lines curl downward halfway.
Currently, Ethereum trades at $4,564.94 after testing the resistance at 4,619.99 with over 102 daily trade volumes.
Technical Indicators
Major Resistance Levels: $4,619, $4,700, and $4,800
Major Support Levels: $4,431, $4,162, and $3,904
Ethereum Technical Analysis
Technically, Ethereum against Tether still retains its bullish structure, operating within the upper limit and the dynamic mid-band level. However, the price appears to be at a critical point as momentum seems to be dropping after a face-off around $4,700.
Also, the Stochastic RSI is at around the mid-level, with lines showing the indecisiveness among the bulls and bears. However, since the market structure is still bullish, an increase in the participatory level with the price claiming the $4,619 will send the price north. Conversely, continued bearish movement would terminate the bullish continuation move.
Ethereum’s Target Reached: What’s Next?
Ethereum is currently in a holding pattern with the Fed interest rate in view. However, the overall sentiment on the broader structure is still considered bullish, but in the past four weeks, a significant move has not been made by the token. As it stands, Ethereum is operating within a close range, and from an Elliot Wave perspective, the market has no convincing uptrend at the moment, as the momentum is too weak. To this end, an uptrend may be spotted only by holding above the support in the near term.
ETH/USDT Analysis: Strong Momentum but Overbought Conditions Signal Caution
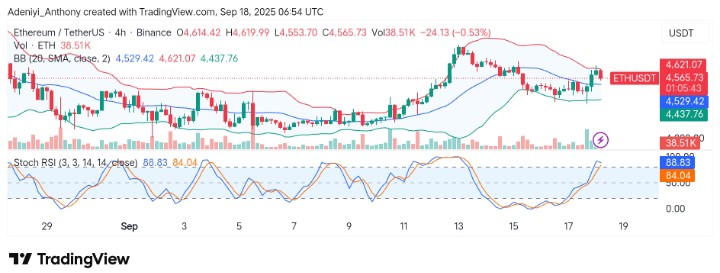
ETH/USDT’s recent price action indicates a continuation of the bullish trend. However, on the 4H chart, the pair seems to be moving farther from the upper boundary of the Bollinger Bands, suggesting increasing take-profit action. Additionally, the momentum oscillator displays an overbought signal with downward curling lines.
To this end, while the $4,437 remains critical, only an increasing buying pressure can push the price beyond $4,621; otherwise, the pair will have to build a base above the dynamic mid-band on this timeframe before considering another leg up.
You can purchase crypto coins here. Buy Crypto