Fantom (FTM/USD) May Be Preparing to Enter a Consolidation Phase Above $0.800
Estimated Reading Time: 3 minutes
Don’t invest unless you’re prepared to lose all the money you invest. This is a high-risk investment and you are unlikely to be protected if something goes wrong. Take 2 minutes to learn more
The Fantom market has gracefully danced along a lateral path, delicately tracing its steps within the confines of a tight price corridor hovering around the $0.300 milestone, a pattern sustained since January. Yet, as the curtains drew close on February’s performance, whispers of a forthcoming breakout echoed through the market’s halls, soon unveiling a bullish fervor that gathered momentum with the dawn of March, injecting a palpable sense of dynamism into the atmosphere.
Fantom Market Data
- FTM/USD Price Now: $0.9191
- FTM/USD Market Cap: $2.6 billion
- FTM/USD Circulating Supply: 2.8 billion
- FTM/USD Total Supply: 3.2 billion
- FTM/USD CoinMarketCap Ranking: #46
Key Levels
- Resistance: $1.00, $1.50, and $2.00.
- Support: $0.85, $0.80, and $0.75.
Fantom Market Analysis: The Indicators’ Point of View
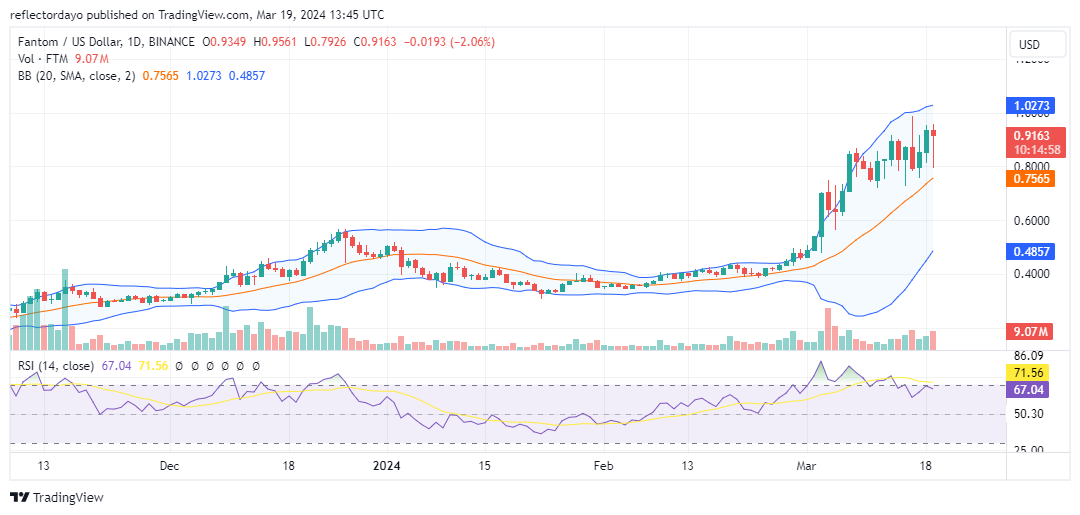
Noteworthy is the Fantom market’s notable surge beyond the $0.800 threshold, eliciting a surge in volatility as it approaches the esteemed $1.00 milestone. However, amidst this bullish momentum, bears strategically exploit the heightened volatility to erect formidable resistance barriers around the critical $1.00 price level against the advancing bull market.
Presently, with the market maintaining its lateral position above the $0.800 mark, the specter of dwindling trade volumes casts a shadow over proceedings, indicative of the impasse currently gripping prices. Furthermore, the RSI line, hovering at the edge of the overbought territory, suggests a potential scarcity of buying opportunities at present. As per crypto signals, the market may be poised for a period of consolidation before embarking on a definitive trajectory.
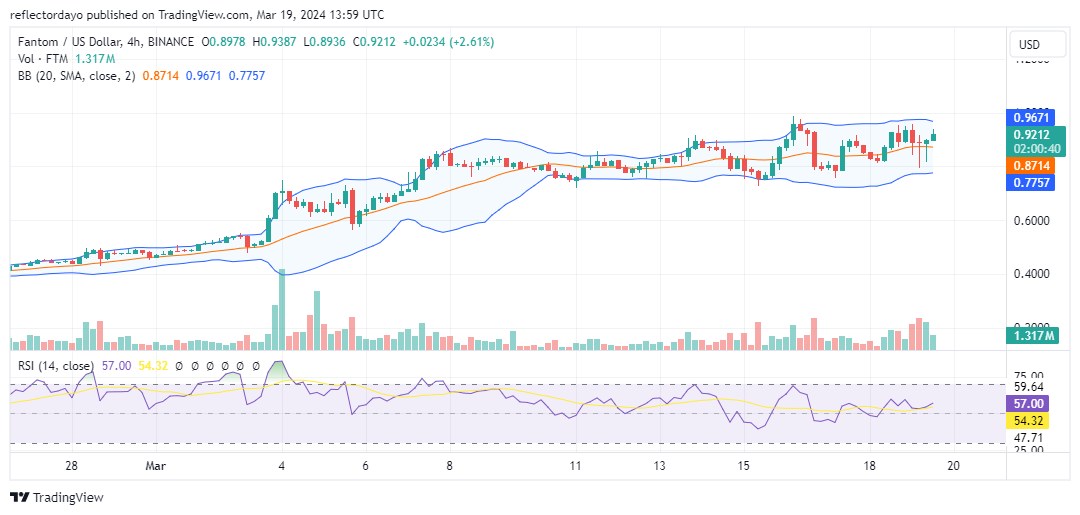
FTM/USD 4-Hour Chart Outlook
From the 4-hour chart analysis of the market, it is evident that bulls are maintaining their position above the 20-day moving average, underscoring their current dominance. Nevertheless, they are encountering resistance near the $0.900 and $1.000 price levels. Additionally, indicators from this perspective suggest the potential for consolidation, indicating a narrowing of the Bollinger Bands as trade volume decreases amidst the prolonged struggle at this juncture in the market.