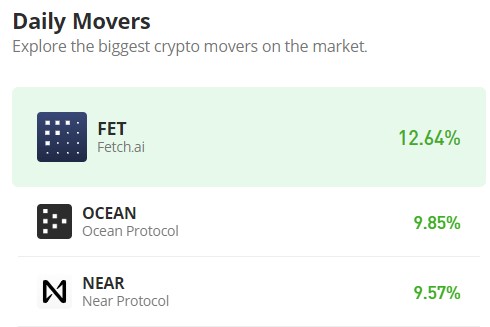
Fetch.ai (FET/USD) Recovers From Below $1.50
Estimated Reading Time: 3 minutes
Don’t invest unless you’re prepared to lose all the money you invest. This is a high-risk investment and you are unlikely to be protected if something goes wrong. Take 2 minutes to learn more
In March, the Fetch.ai market targeted stability above the $3.00 price level, leading to price action struggling within this range from March to April. The sustainability of the price above $3.00 became unlikely as volatility increased while the market consolidated near this level. However, the bulls showed substantial strength, propelling the market to a high of $3.50 on March 28. This triggered bearish momentum, and by April, the bears had gained significant ground.
Fetch.ai Market Data
- FET/USD Price Now: $1.7
- FET/USD Market Cap: $1.4 billion
- FET/USD Circulating Supply: 848 million
- FET/USD Total Supply: 2.6 billion
- FET/USD CoinMarketCap Ranking: #61
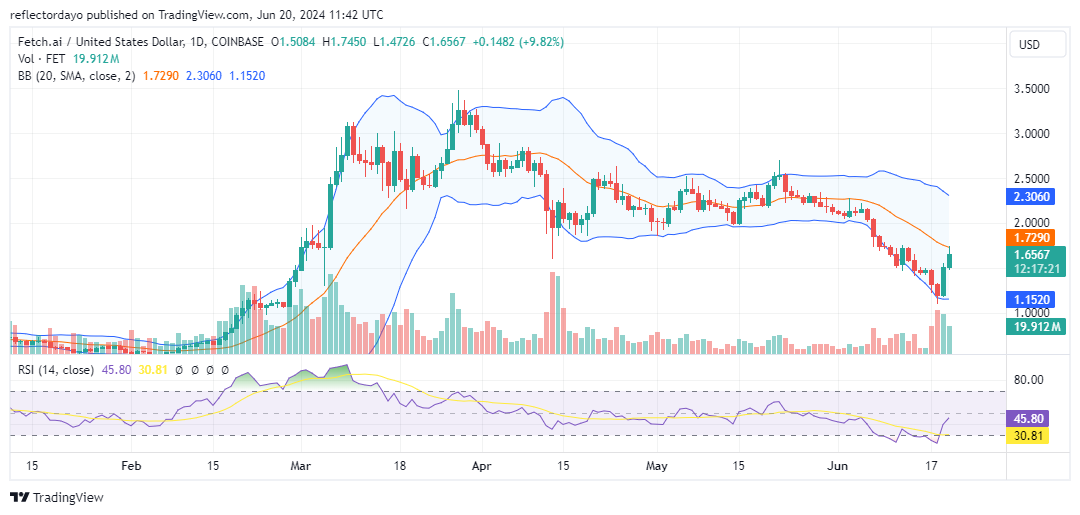
Key Levels
- Resistance: $2.00, $2.50, and $3.00.
- Support: $1.15, $1.10, and $1.00.
Fetch.ai Market Analysis: The Indicators’ Point of View
The bearish momentum shifted the Fetch.ai market’s consolidation range from the $2.50-$3.00 channel to the $2.00–$2.50 channel. The reduced bandwidth of the price channel reflects the market’s lower level. Since April, the market has continued to range sideways within this narrow channel until another breakdown occurred, leading to a bullish intervention around the $1.15 price level. Currently, the price action is rallying and has surged above the $1.50 price level. Despite the emergence of bearish resistance, indicated by an upper shadow on the current trading session’s candlestick, the bulls have reclaimed the $1.50 level as support. If they can maintain this support, they may be able to push through the resistance.
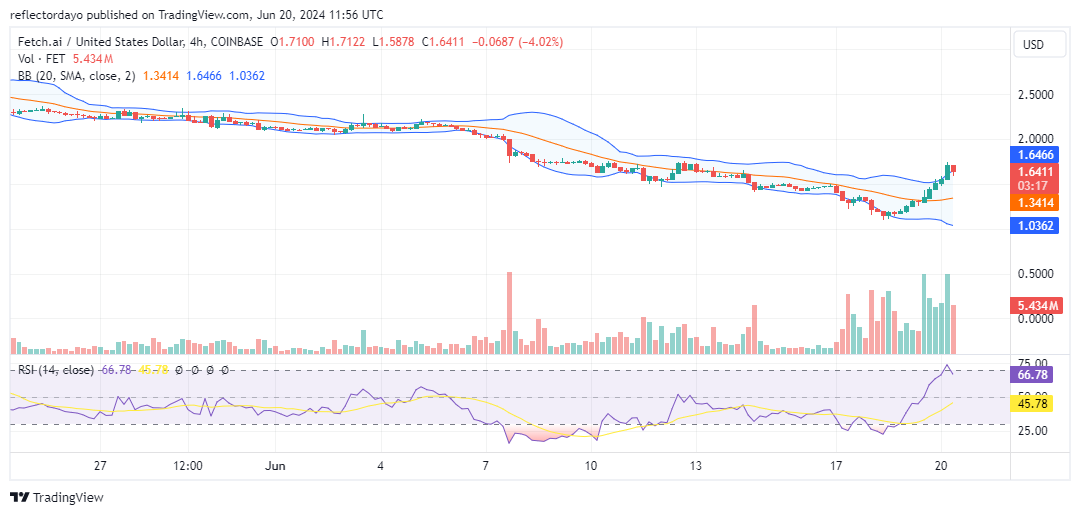
FET/USD 4-Hour Chart Outlook
Looking at the market from the perspective of the 4-hour chart, although the bullish run is progressing, bearish resistance is evident, and traders are becoming increasingly undecided. This is indicated by the significant volume of trade accompanying the upward price action. The candlesticks are not as strong or significant as the trade volume histograms, suggesting trader indecision and a potential sideways range above the $1.50 price level. The Relative Strength Index (RSI) signals a correction from the overbought region, currently at 67, indicating strong bullish momentum. Despite this, the market may consolidate around $1.65.