MANAUSD Indicates Bullish Reversal Signal
Estimated Reading Time: 2 minutes
Don’t invest unless you’re prepared to lose all the money you invest. This is a high-risk investment and you are unlikely to be protected if something goes wrong. Take 2 minutes to learn more
Market Analysis: Price Shows Signs of Bullish Reversal
MANAUSD shows signs of a bullish reversal. MANA price has dipped beyond the swing low that was established at the inception of the year. MANAUSD price action on the daily chart has been very clear with obvious breaks and retest of demand levels. The price seems ready for a takeoff as the sell side delivery is fulfilled.
MANAUSD Key Levels
Demand Levels: $0.2680, $0.2550
Supply Levels: $0.3200, $0.4200
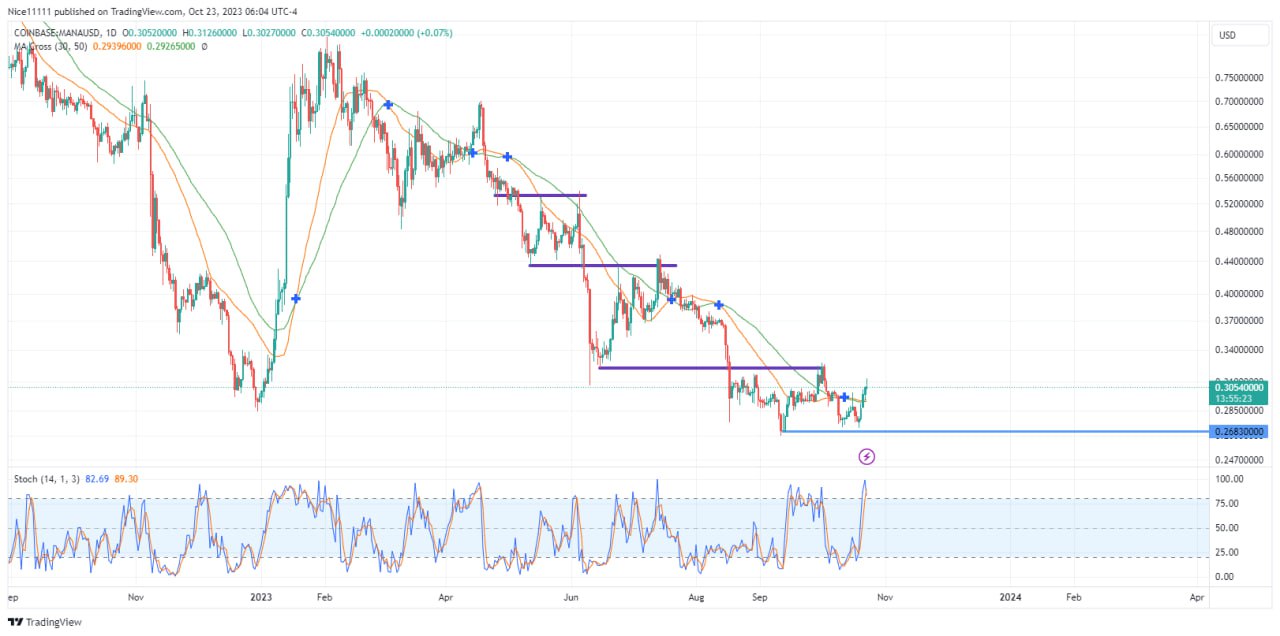
On the 4th of March, the Moving Averages (Periods 30 and 50) crossed to signify the pullback in the market. The pullback eventually transformed into a reversal after MANA price dipped past the swing low in March. The swing low ought to function as a support for a price push-up. The failure of the swing low confirmed the downward trend.
The press on the Moving Averages in June provided shorting opportunities. A double-top bearish reversal pattern is obvious on the chart just before the crash into $0.3200. A complex pullback tested the failed demand zone of $0.4400 twice just before a final displacement below the swing low of January.

MANAUSD Market Expectation
A Double-bottom bullish reversal pattern has formed on the demand level of $0.2680. The Stochastic is signifying an oversold market. A retest of the neckline is anticipated to inject buying pressure. Bulls are likely to fill long orders at the neckline. The closest liquidity region rests at $0.3200.
You can purchase Lucky Block here. Buy LBLOCK
Note: Cryptosignals.org is not a financial advisor. Do your research before investing your funds in any financial asset or presented product or event. We are not responsible for your investing results.