Kyber Network (KNC/USD) Confirms Bullish Momentum with a Bounce from $0.55
Estimated Reading Time: 4 minutes
Don’t invest unless you’re prepared to lose all the money you invest. This is a high-risk investment and you are unlikely to be protected if something goes wrong. Take 2 minutes to learn more
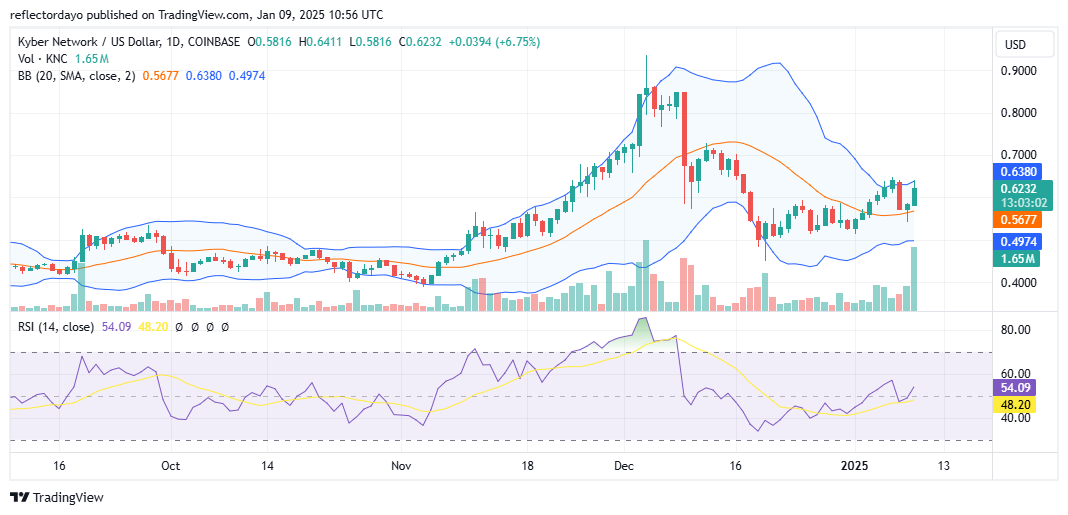
The Kyber Network is currently attempting to regain bullish momentum after finding pivotal support at the $0.45 level. The price action has shown minor upward shifts from recent lows, indicating a gradual recovery.
The ongoing price movement suggests that the bulls are steadily breaking through key bearish resistance levels, achieving incremental gains in price.
Before the emergence of the current bullish trend, the market experienced a strong bearish phase. This downturn followed a significant bull run that began in early November and peaked in early December of last year. The previous bearish trend led to increased market volatility, which partially explains the measured pace of the ongoing bullish recovery.
Kyber Network Market Data
- KNC/USD Price Now: $0.62
- KNC/USD Market Cap: $116.3 million
- KNC/USD Circulating Supply: 186.6 million KNC
- KNC/USD Total Supply: 239.6 million KNC
- KNC/USD CoinMarketCap Ranking: #427
Key Levels
- Resistance: $0.70, $0.75, and $0.80
- Support: $0.55, $0.50, and $0.45.
Kyber Network Through the Lens of Indicators
The previous bearish run, which ended around the $0.45 price level on December 20, was notably strong and triggered heightened market volatility. However, the market’s ability to establish support at $0.45 underscores the strength of the bullish bias. This is evident in the consistent formation of slightly higher lows, indicating that bullish sentiment is gaining ground against bearish pressure.
Despite the apparent resilience of the bulls in this crypto signal, the key question remains: can they break the resistance at $0.645? This resistance level, established on January 6, has successfully repelled multiple bullish advances. The repeated rejection at this price point highlights the critical nature of this level for the continuation of the bullish trend.
A successful breakout above $0.645 would likely attract further bullish sentiment. However, the bears remain active at this resistance, as seen in today’s trading session. The bullish candlestick features a small upper shadow, reflecting persistent selling pressure at this level.
Additionally, discrepancies between price action and the trading volume histogram are notable. While the histogram indicates significant trading activity, today’s bullish candlestick appears weaker in comparison. The presence of a small upper wick on the candlestick further suggests resistance at $0.645.
For the bullish momentum to continue, breaking through this resistance level is crucial. Until then, the Kyber Network market remains at a pivotal juncture.
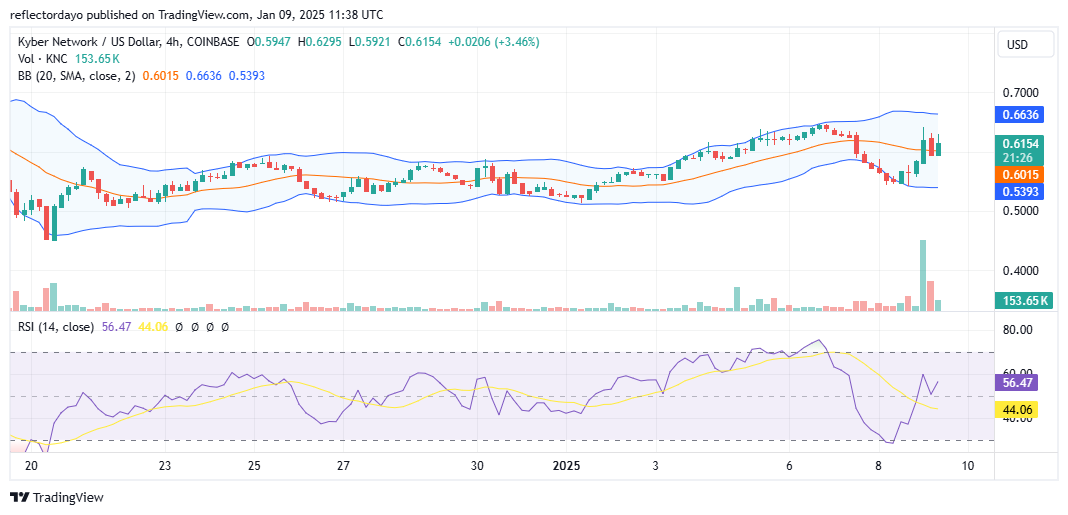
KNC/USD Price Prediction: 4-Hour Chart Analysis
A closer examination of the 4-hour chart for the Kyber Network market reveals promising signs that a breakout above the critical $0.645 resistance level could be imminent. This optimism is supported by the consistent formation of higher lows visible within this timeframe, signaling sustained bullish momentum.
However, the repeated rejection of price at this resistance level indicates strong bearish presence, suggesting that the market faces significant headwinds at this critical point.
If a breakout fails to materialize, the market may consolidate around the $0.60 price level. Such consolidation could stabilize the price and provide a foundation for a potential continuation of the ongoing bullish trend.
Trade crypto coins on BYBIT!