Litecoin (LTC) Price Prediction: LTC/USDT Breaks the $100 Mark
Estimated Reading Time: 3 minutes
Don’t invest unless you’re prepared to lose all the money you invest. This is a high-risk investment and you are unlikely to be protected if something goes wrong. Take 2 minutes to learn more

Litecoin (LTC) Price Prediction December 3:
The Litecoin token now trades above the $100 mark. The market has tested the resistance at the $140 resistance price level. But headwinds have caused a downward contraction, but the market still looks ready to go higher.
LTC/USDT Long-Term Trend: Bearish (Daily Chart)
Key Price Levels:
Resistance: $150, $175, $200
Support: $125, $100, $75
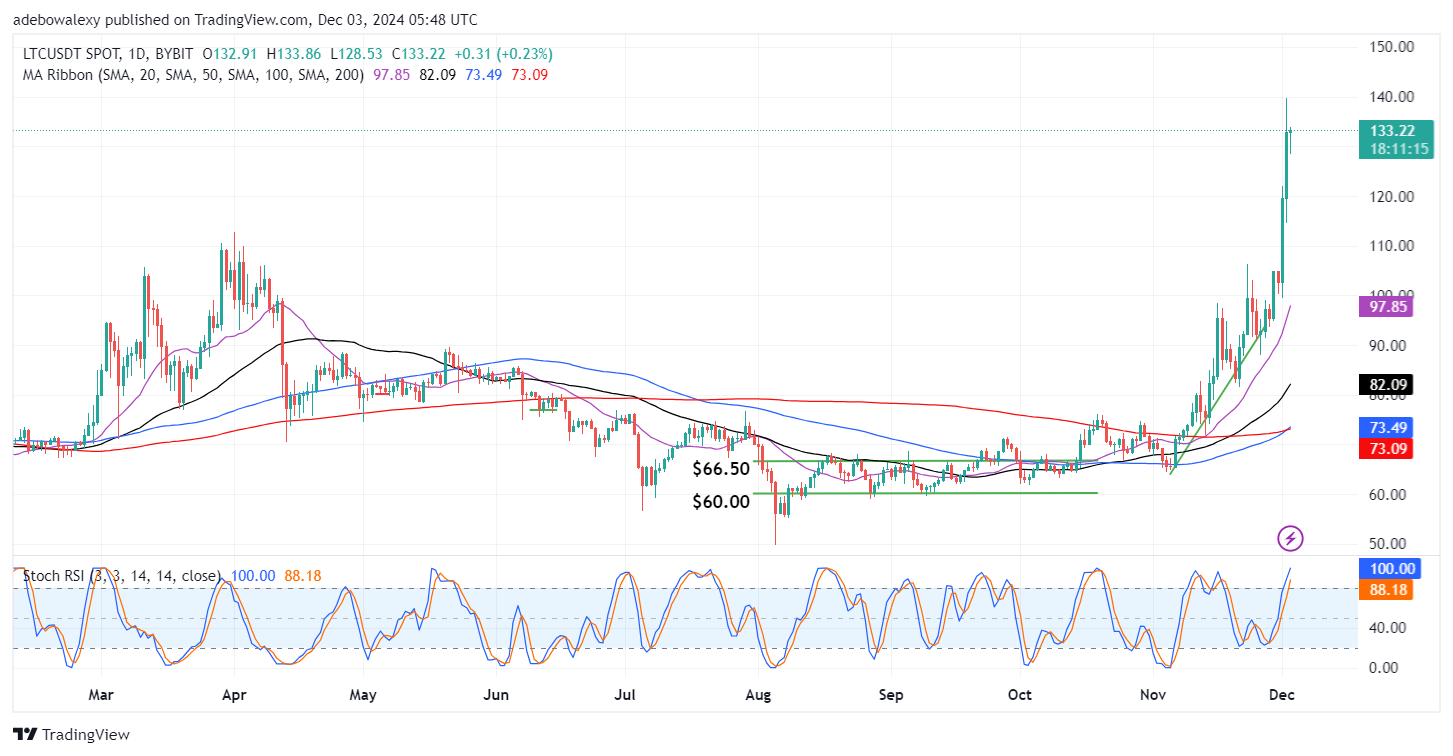
On Litecoin’s daily chart, price action can be seen to have risen significantly higher. Also, the ongoing session stays in the green at a considerable distance above all the MA lines. The 100- and 200-day Moving Average (MA) lines can be seen delivering a crossover below price action. Also, the Stochastic Relative Strength Index (RSI) indicator lines are still rising into the overbought region, without having any form of deflection on it.
Litecoin (LTC) Price Prediction: LTC/USDT Bulls Still Seem to Be in Chip Shape
While Litecoin’s price action can be seen to have risen significantly in recent sessions, the upside correction has appeared the strongest over the past two sessions as the market broke through multiple resistance price levels within a short time. Likewise, the last price candle on this chart has appeared green while standing above the $130 price level.
Meanwhile, market activity remains above all the MA curves on the chart, while the 100- and 200-day MA lines are delivering a crossover below price action. The Stochastic RSI indicator lines can be seen still rising upwards despite the downward correction that occurred in the previous session. Therefore, it seems upside forces are still ready for more thrusts.
Litecoin (LTC) Price Prediction: LTC/USDT Eyes a Revisit of the $140 Mark (4-Hour Chart)
Price action in the Litecoin 4-hour market has indications that hint that market participants are eyeing a revisit of the $140 price level. Here, the last price candle can be seen standing just above the technical support at the $130 price level. Likewise, the mentioned price level stands above all the MA lines on the price chart. The last price candle can be seen appearing solid green as it stands above the mentioned support level.
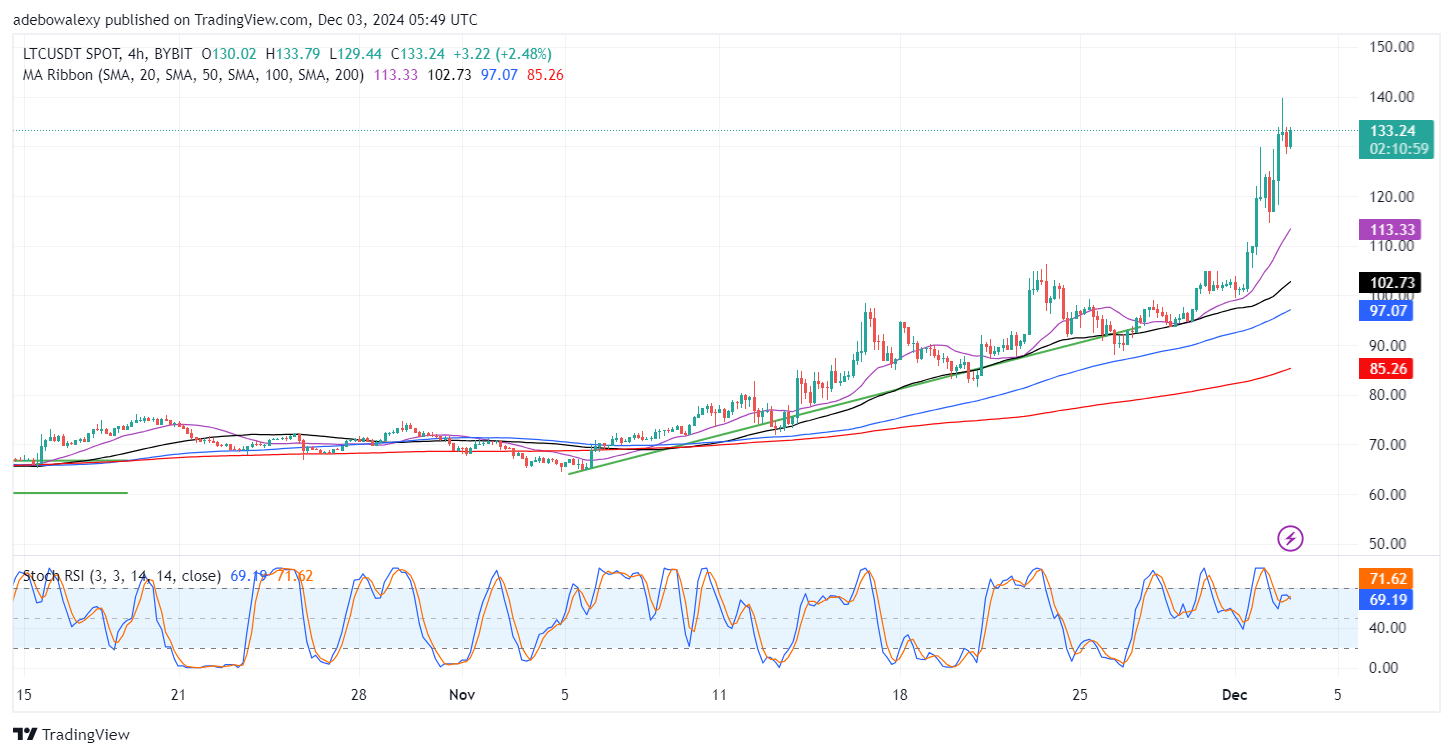
Also, the Stochastic RSI lines have now delivered a crossover, with the ensuing lines now pointed sideways. Consequently, this hints that downward forces aren’t that influential at this point. However, considering all the other indications on the market, it appears that upside forces are still tipped to extend upside corrections.