Litecoin (LTC) Price Prediction: LTC/USDT Plunges Deeper
Estimated Reading Time: 2 minutes
Don’t invest unless you’re prepared to lose all the money you invest. This is a high-risk investment and you are unlikely to be protected if something goes wrong. Take 2 minutes to learn more

Date: December 2, 2025
The Litecoin market has maintained its high correlation with the Bitcoin market. This is evident as prices in this market have crashed in response to Bitcoin’s unexpected dip. As such, price movement in this market remains oriented in a way that suggests steeper falls in subsequent sessions.
LTC/USDT Long-Term Trend — Bearish (Daily Chart)
Key Price Levels
Resistance: $80, $90, $95
Support: $75, $70, $65
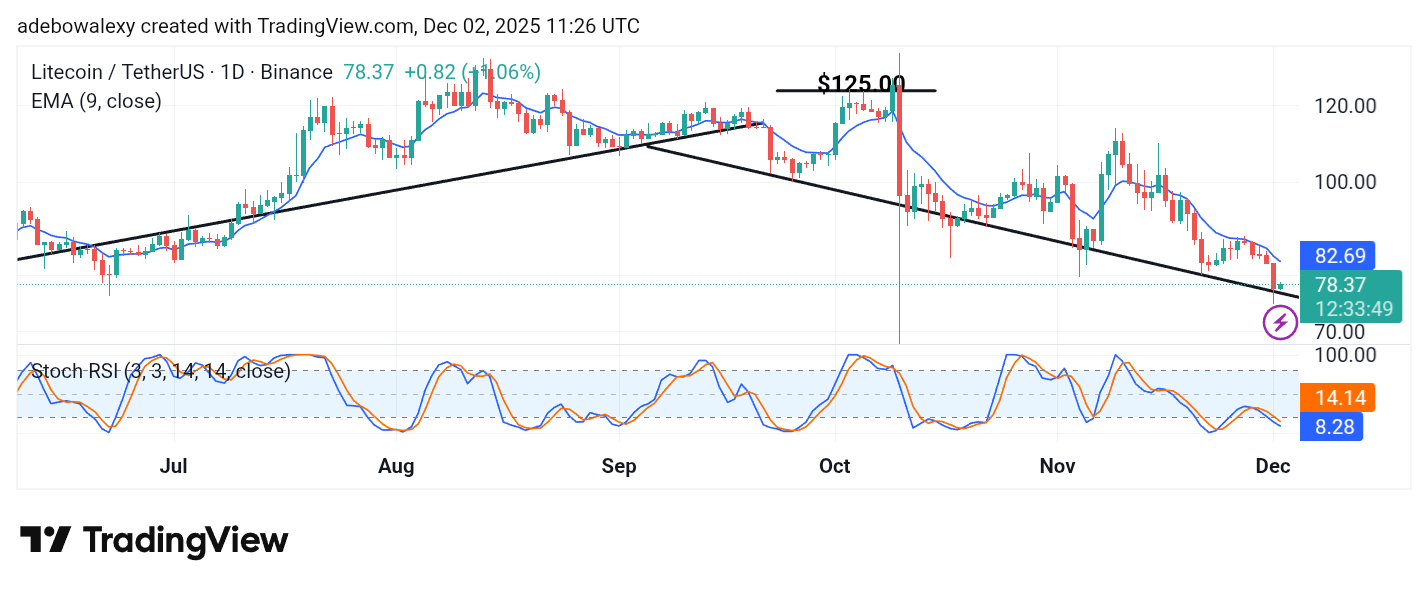
The ongoing session in the Litecoin daily chart shows price activity falling further below the 9-day Exponential Moving Average. The current price candle is green but reflects minimal price change. Likewise, the lines of the Stochastic Relative Strength Index (SRSI) indicator continue to dive into the oversold region without any deflection.
Litecoin (LTC) Price Prediction: LTC/USDT May Proceed South
The gains presented during the current session remain quite minimal, to the point that they appear largely unreflected on technical indicators such as the SRSI.
This is because the last price candle on the chart is a green one with a very small body. Likewise, its distance below the 9-day EMA curve suggests that bearish forces remain strong. This keeps the market descending within a downward-sloping price channel.
The lines of the SRSI indicator can be seen descending further into the oversold region. This hints that price activity may stay depressed.
Litecoin (LTC) Price Prediction: LTC/USDT Tries to Escape Gravity (4-Hour Chart)
On the Litecoin 4-hour chart, it is visible that price action has been attempting to climb in order to secure short-term gains.
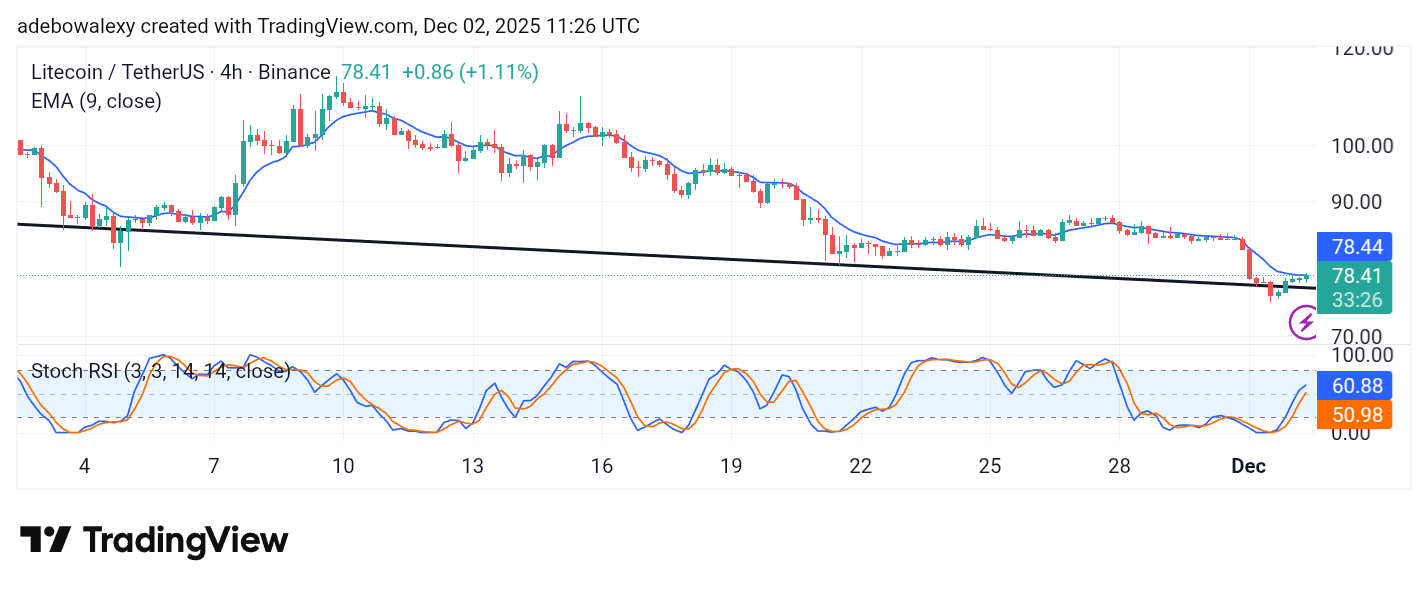
The last price candle on this chart is pushing against the ceiling formed by the 9-day EMA curve. The mentioned price candle is green, as can be seen.
The SRSI indicator lines are rising steadily toward the 70 mark. However, the lead line of the indicator shows a deflection. This aligns with the fact that price action is testing the 9-day EMA curve from below. Therefore, it appears headwinds may push this market toward the $75 mark.