Litecoin (LTC) Price Prediction: LTC/USDT Rebounds Upward at the $65.00 Baseline
Estimated Reading Time: 3 minutes
Don’t invest unless you’re prepared to lose all the money you invest. This is a high-risk investment and you are unlikely to be protected if something goes wrong. Take 2 minutes to learn more

Litecoin (LTC) Price Prediction for November 5
The LTC/USDT’s price action can be seen oscillating within a wide price range of $65 and $75 from mid-October till now. Price activity in this market seems pretty confined within this stated price range. As a result, price action has formed an “M” pattern that suggests a bearish breakout.
LTC/USDT Long-term Trend: Bearish (Daily Chart)
Key Price Levels:
Resistance: $70.00, $75.00, $80.00
Support: $65.00, $60.00, $55.00
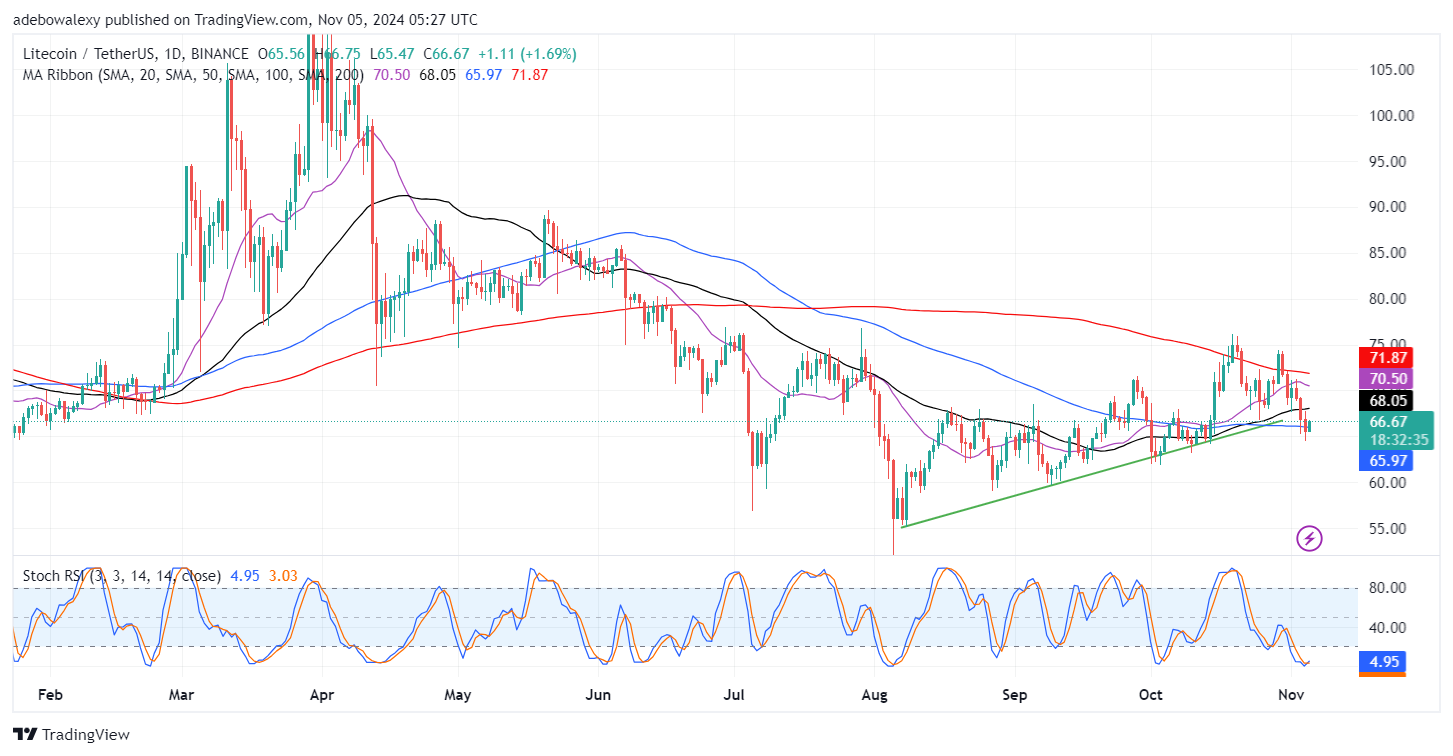
The last price candle on the chart has appeared bullish. As a result, this brings the market to rebound off the support level at the $65.00 mark. Nevertheless, price action remains below most of the applied Moving Average (MA) lines but above the 200-day MA. Also, the Stochastic Relative Strength Index (RSI) lines can be seen still in the oversold region, though the terminal of this line has an upward trajectory at the moment.
Litecoin (LTC) Price Prediction: LTC/USDT Still Appears Vulnerable
The Litecoin daily market has recorded a modest recovery as of the time of writing. However, this hasn’t totally saved the market from the possibility of further price decline from a technical point of view. Price action remains below the majority of the MA curves, even the faster ones such as the 20-, 50-, and 100-day MAs, and stands above the 200-day MA.
Similarly, the Stochastic RSI lines are deep in the oversold region but have an upward trajectory, which aligns with the seen upward price rebound. Consequently, it does seem likely that price action hasn’t come out of the danger zone. And going by the formed pattern by price action within the $65 and $75 price region, a bearish breakout still appears possible.
Litecoin (LTC) Price Prediction: LTC/USDT May Have Come Under Pressure (4-Hour Chart)
In the Litecoin 4-hour market, we can see that price activity has been rebounding upwards since the previous session. However, the last price candle on this chart appears smaller and with an upper shadow. Additionally, recent price action here lies below all the MA curves despite the upside rebound. Meanwhile, the Stochastic RSI lines are still rising upward to confirm the recent upward rebound of price activity. However, the movement of these indicator lines seems hypersensitive.
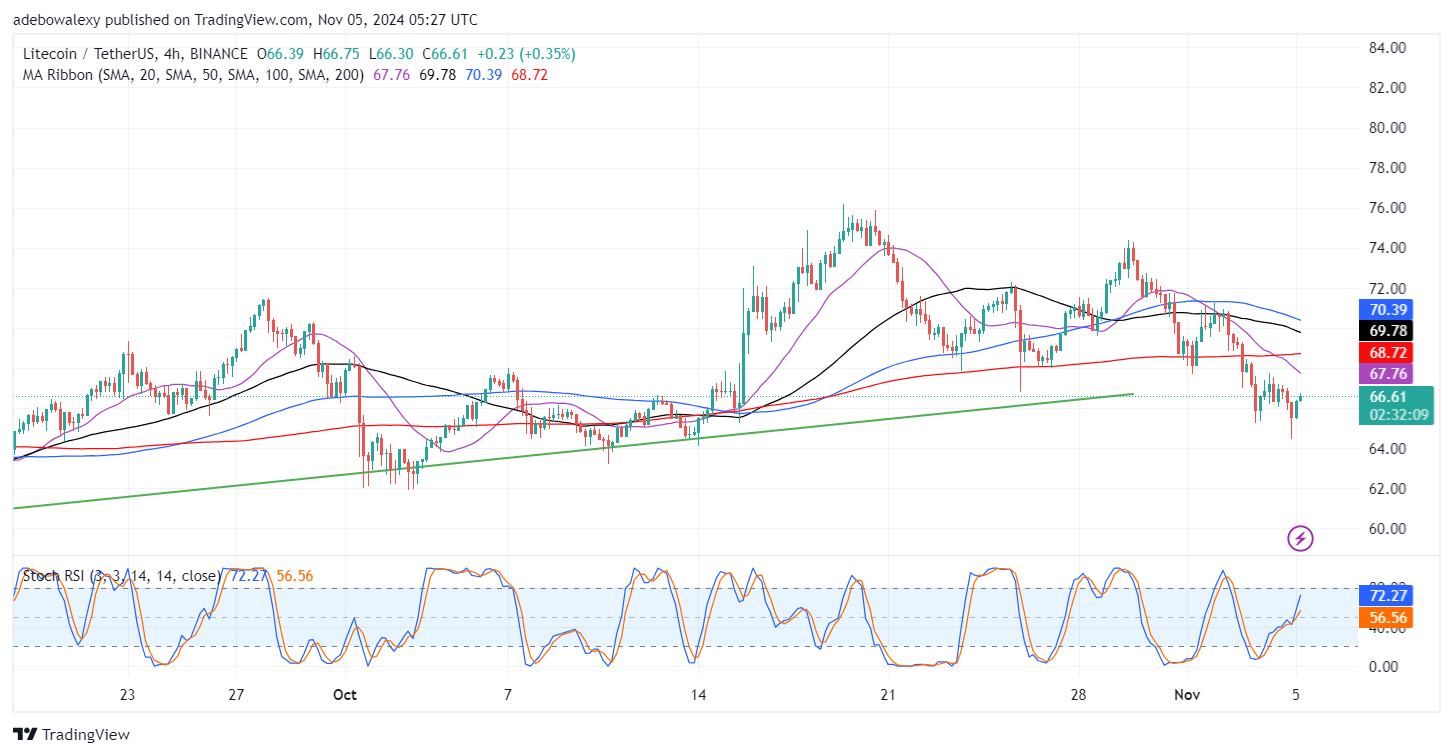
The appearance and position of the last price candle here point to the fact that downward forces are still viable and can significantly influence price movement. The behavior of the Stochastic RSI lines does seem to capture the current price activity but may not sustain bullish sentiment. Therefore, it seems likely that price action may fall through the $65 threshold and toward the $60 price level.