Litecoin (LTC/USD) Signals a Potential Bullish Turnaround
Estimated Reading Time: 3 minutes
Don’t invest unless you’re prepared to lose all the money you invest. This is a high-risk investment and you are unlikely to be protected if something goes wrong. Take 2 minutes to learn more
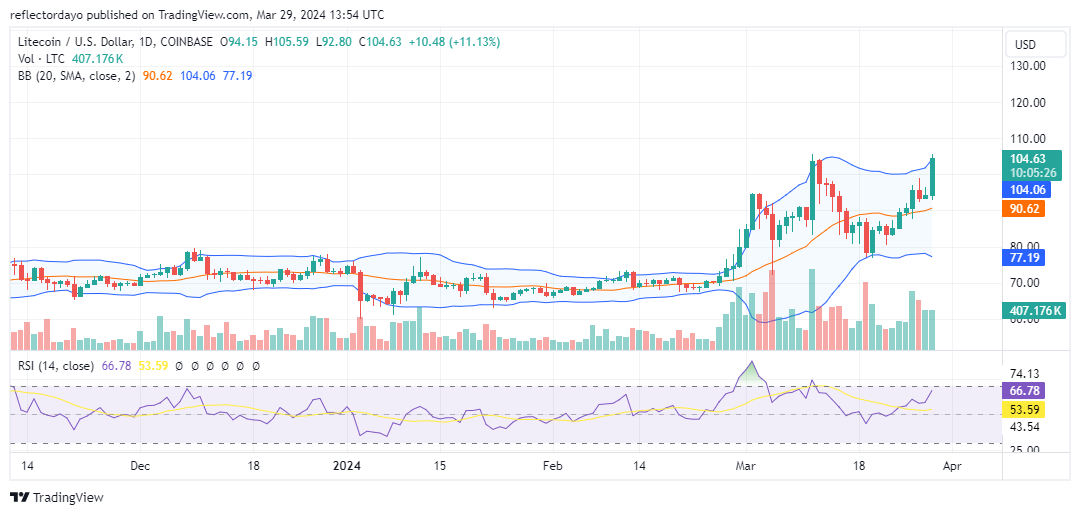
The Litecoin market has remained stagnant since the beginning of the year, hovering around the $70 mark. This lack of substantial movement suggests a notable lack of interest among traders to initiate significant buying or selling activities, resulting in the market persistently moving sideways at this pivotal price level. However, at the onset of March, a bullish shift occurred, propelling the market from $70 to the $80 and $104 price ranges. Although this led to increased market volatility, both bears and bulls continue to demonstrate balanced strength, resulting in a relatively even match between the two.
Litecoin Market Data
- LTC/USD Price Now: $104
- LTC/USD Market Cap: $7.7 billion
- LTC/USD Circulating Supply: 74 million
- LTC/USD Total Supply: 84 million
- LTC/USD CoinMarketCap Ranking: #19
Key Levels
- Resistance: $110, $115, and $120.
- Support: $90, $85, and $80.
Litecoin Market Analysis: The Indicators’ Point of View
The Litecoin market achieved its initial high of $94 on the second day of March, followed by a subsequent high on March 11. Today presents another opportunity for the market to reach a new high, although the presence of bears is currently evident at the $104 price level, which coincides with the previous market peak. Despite this, the market continues to exhibit signs of bullish dominance. However, the breakthrough of this resistance level is crucial to establishing an upward trend for the bulls. Failure to do so would result in the market being considered to range within a wide price channel, akin to the assessment provided by the Bollinger Bands indicator. Although the market is currently moving sideways, it does so with heightened volatility.
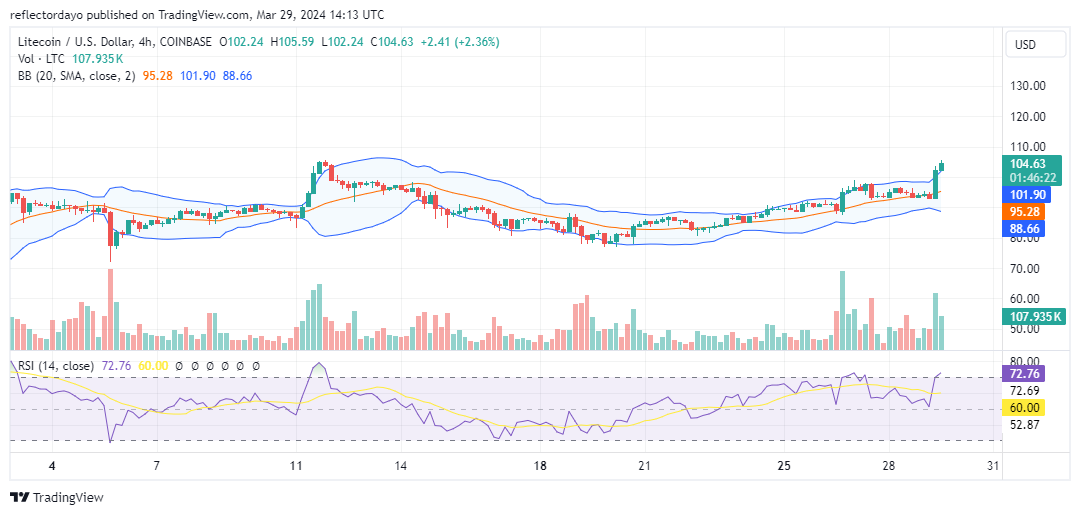
LTC/USD 4-Hour Chart Outlook
As the market nears the crucial resistance level of $104, bearish activity becomes apparent, leading to a retracement in bullish momentum. The likelihood of the market surpassing this pivotal resistance diminishes further as trading volume, as indicated, begins to dwindle. Should bears, according to this crypto signal, successfully push the price below the bullish support levels around $100 and $95, it may pave the way for a shift in favor of the bulls, with the $77 price level emerging as a potential stronghold. However, failure to maintain support at these levels could prompt bulls to reassess their strategy at the $77 price level.