Litecoin Price Prediction: LTC/USDT Retains Support Above $120
Estimated Reading Time: 2 minutes
Don’t invest unless you’re prepared to lose all the money you invest. This is a high-risk investment and you are unlikely to be protected if something goes wrong. Take 2 minutes to learn more

Litecoin Price Prediction (February 18):
The Litecoin market has been gaining upward momentum in recent trading sessions. Currently, the token is trading above the $120 mark. Moreover, the market is recovering from recent downward corrections, suggesting that price action may be ready to advance higher.
LTC/USDT Long-Term Trend: Bullish (Daily Chart)
Key Price Levels:
Resistance: $130.00, $140.00, $150.00
Support: $120.00, $110.00, $100.00
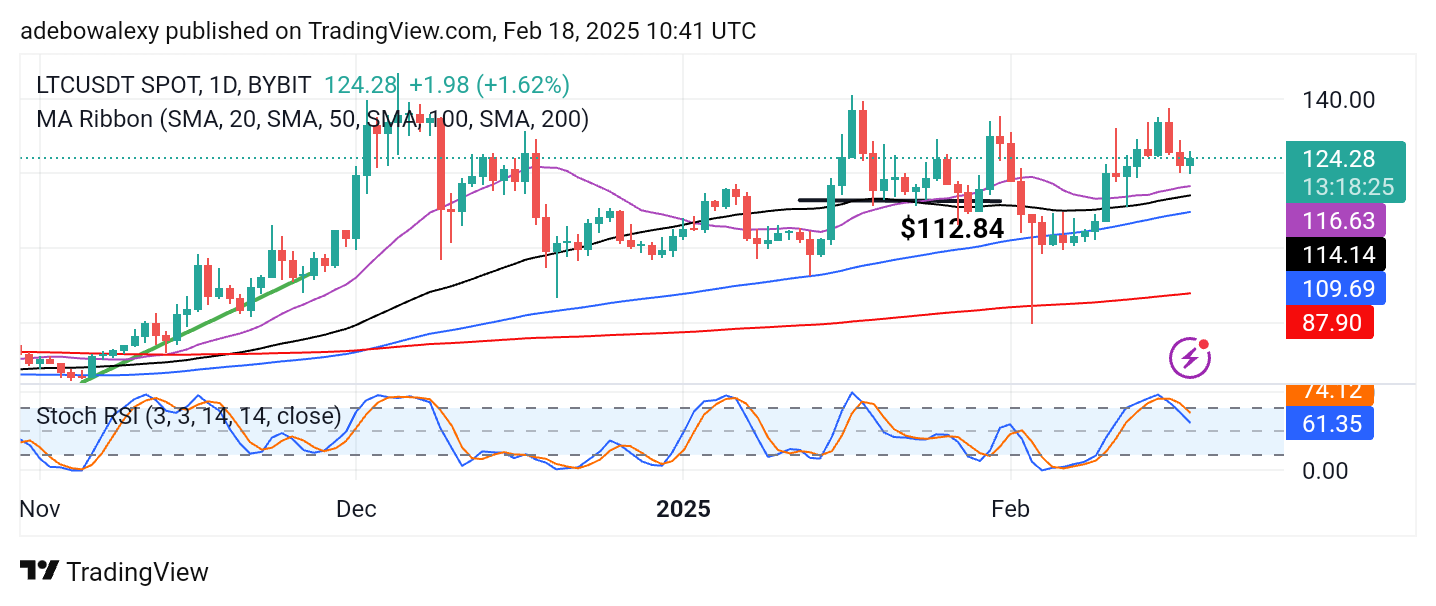
Following a two-session downward retracement, the ongoing session has formed a green price candle. This candle stands above the key technical support level of $120. Additionally, price action remains above all Moving Average (MA) lines. However, the Stochastic Relative Strength Index (RSI) lines are still slightly descending toward the 50 mark, despite the appearance of a bullish price candle on the chart.
Litecoin Price Prediction: LTC/USDT Bulls Stage a Comeback at Favorable Support
Trading activity in the Litecoin market has remained above all MA lines. Since breaking above these indicators eight sessions ago, the market has continued to trade above them. The current session suggests that price action is rebounding off the $120 support level. However, the Stochastic RSI lines are still descending, likely due to the recent two-session retracement.
Despite this, the market maintains a strong support impression at the $120 level. If buyers regain confidence, we may see further upward movement from this point.
Litecoin Price Prediction: LTC/USDT Hugs the 50-Day MA Line (4-Hour Chart)
Examining the 4-hour chart, recent price candles have been hovering around the 50-day MA curve. The latest price candle is green, reinforcing the impression that buyers are in control. Additionally, the Stochastic RSI lines are trending upward toward the 50 level, signaling potential bullish momentum.
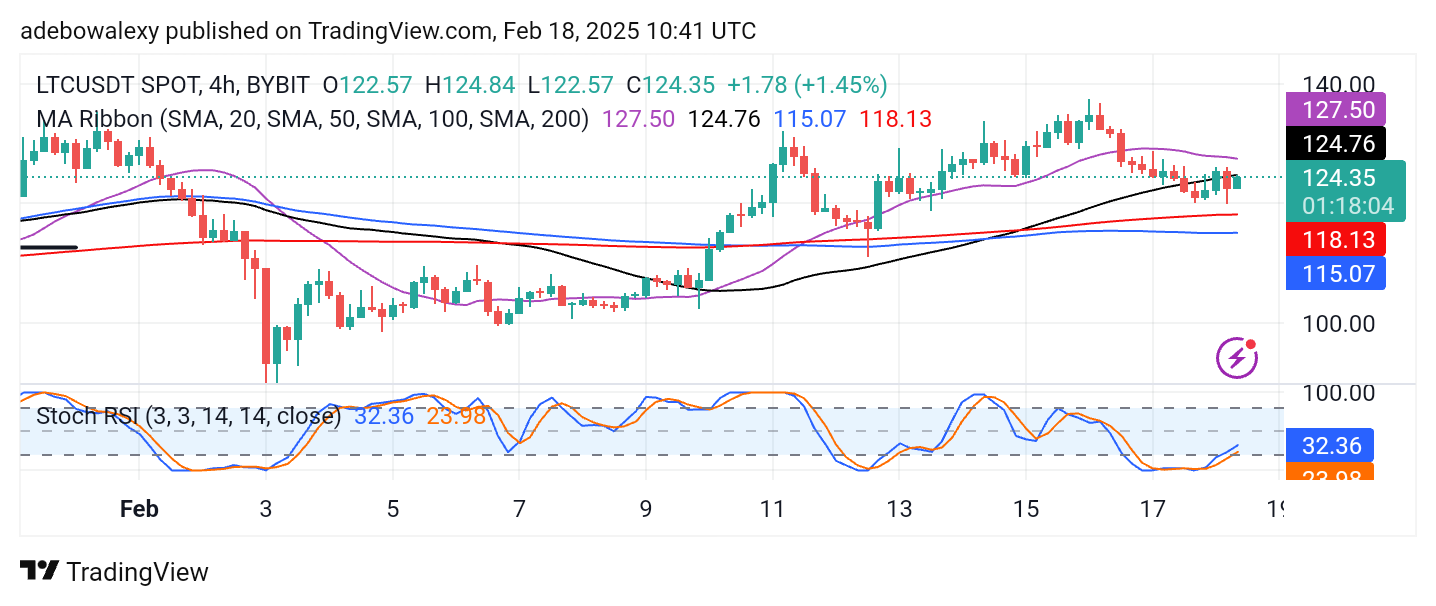
The technical indicators support the expectation of a rebound. The presence of a green price candle on both the 4-hour and daily charts suggests ongoing buying activity in the market. Therefore, traders may target the $125 and $130 levels as potential short-term price objectives.


