Lucky Block (LBLOCK/USD) Market Approaches Major Support
Estimated Reading Time: 3 minutes
Don’t invest unless you’re prepared to lose all the money you invest. This is a high-risk investment and you are unlikely to be protected if something goes wrong. Take 2 minutes to learn more

Lucky Block Price Forecast – August 5
The LBLOCK/USD market approaches major support at $0.00001540. A complete reversal is imminent, especially with the Stochastic Oscillator indicating an oversold state.
The technical indicators for LBLOCKUSD suggest a potential bullish reversal. The Stochastic Oscillator shows oversold conditions, with the %K line crossing above the %D line at a low level of 17.18 and 8.37, respectively, indicating likely upward momentum. The Simple Moving Average (SMA) of 9 periods is presently at $0.00001870, and the price has recently touched this level, which can act as a support, suggesting a possible price bounce from this region.
LBLOCK/USD Market Key Levels:
Resistance levels: $0.00002440, $0.00004500, $0.00007460
Support levels: $0.00001540, $0.00001400, $0.00000930
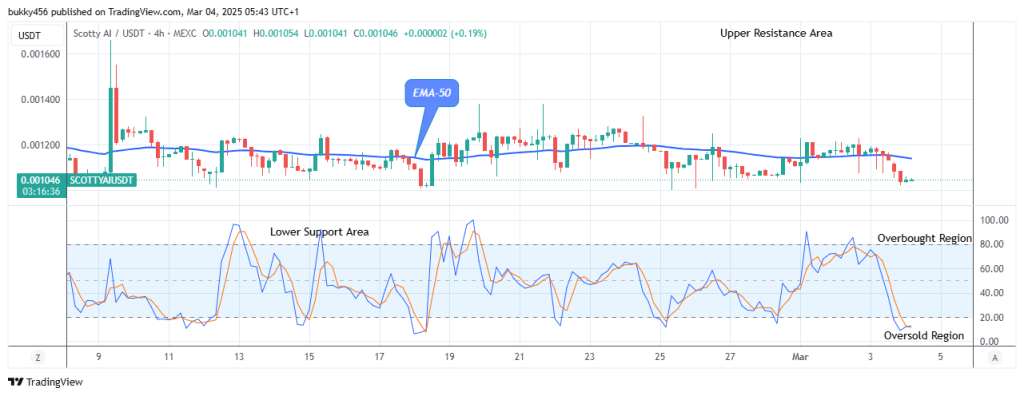
LBLOCK/USD – Daily Chart
The daily chart for LBLOCK/USD shows that a complete reversal is imminent as the market approaches the major support at $0.00001540.
Analyzing the price actions on the chart, LBLOCKUSD experienced a significant downtrend from its peak at approximately $0.00007460 in early March. This downtrend was characterized by lower highs and lower lows, as depicted by the descending trendline.
However, in mid-July, the price action showed signs of consolidation and formed a double bottom around $0.00001540, a bullish reversal pattern. The price has now broken above the downtrend line, indicating the potential end of the bearish phase and the beginning of a new bullish cycle.

What is expected of LBLOCK/USD in the coming days?
LBLOCKUSD might sustain above the immediate support level of $0.00001540. We could see a bullish move toward the next significant resistance level at $0.00002440.
A break above this level would confirm the bullish reversal and could drive the price towards $0.00003290. In the longer term, if the bullish momentum continues, the price might retest the previous high at $0.00004500.

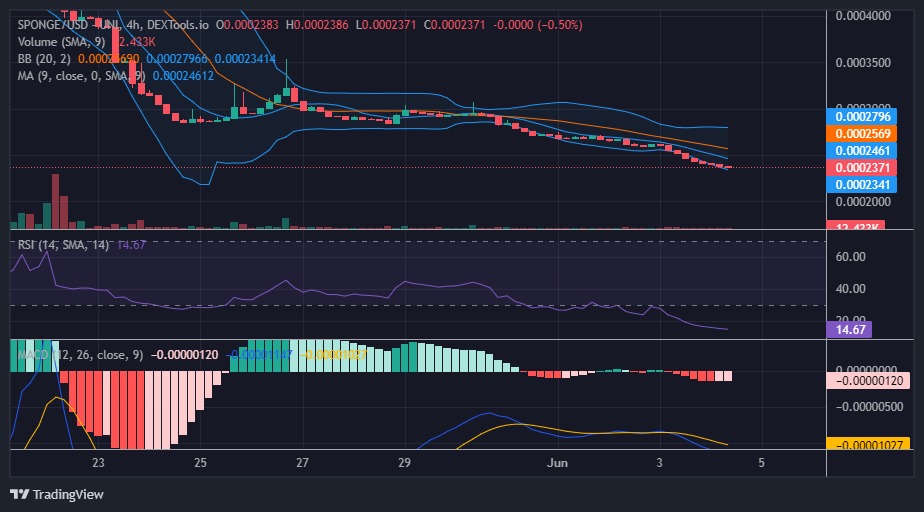
LBLOCK/USD – Four-Hour Chart
The four-hour chart for LBLOCKUSD shows a bullish reversal, supported by the Stochastic Oscillator indicating a potential upward momentum from oversold conditions, with %K at 38.01 and %D at 19.47. The price is currently trading near the support level of $0.00001640, just above the 0.618 Fibonacci retracement level at $0.0000170, suggesting a strong base for a potential rally.
The recent price action displays a formation of higher lows, indicating buying interest and the possibility of a trend reversal. A sustained move above the immediate resistance at $0.00001770 could see LBLOCKUSD targeting the next resistance level at $0.00002200, further confirming the bullish outlook.
Lucky Block (LBLOCK) Current Statistics
The current price: $0.00001690
Market Capitalization: $1,110,000
Trading Volume: $11,620
Do you need a coin that will 100X soon? Get LBLOCK here