Lucky Block (LBLOCK/USD) Market Demonstrates Renewed Upward Resilience Amid Positive Technical Alignment
Estimated Reading Time: 3 minutes
Don’t invest unless you’re prepared to lose all the money you invest. This is a high-risk investment and you are unlikely to be protected if something goes wrong. Take 2 minutes to learn more

Lucky Block Price Forecast – October 6
LBLOCKUSD market demonstrates renewed upward resilience amid positive technical alignment. LBLOCKUSD exhibits a constructive bullish bias as the price maintains stability above the short-term support region near $0.00002450, aligning closely with the 9-day Simple Moving Average (SMA) positioned around $0.00002940.
This sustained interaction above the moving average reflects an underlying accumulation phase, suggesting that market participants are positioning for higher valuations. The MACD indicator reinforces this sentiment, with the histogram approaching a positive crossover zone, indicating a gradual restoration of buyer dominance.
LBLOCK/USD Market Key Levels:
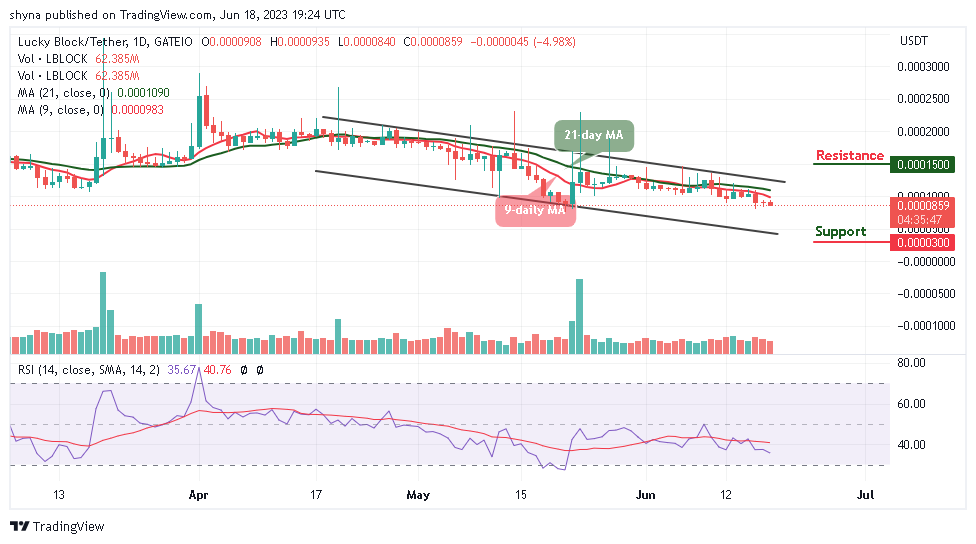
Resistance levels: $0.00004240, $0.00005790, $0.00006500
Support levels: $0.00002450, $0.00002000, $0.00000710

LBLOCK/USD – Daily Chart
The daily chart of LBLOCKUSD shows an impending rally as prices converge at the discount zone.
From a structural standpoint, price action has consistently respected the $0.00002450–$0.00002900 demand zone, forming a robust base of support that has absorbed repeated bearish attempts. The recent consolidation above this region highlights market stability and the diminishing influence of sellers. Multiple rejections near the lower boundary of the highlighted zone illustrate the presence of strong liquidity and active buying pressure. These characteristics collectively point toward a strengthening technical foundation favoring upside continuation.
What is the market outlook of LBLOCK/USD?
Looking ahead, if bullish momentum persists and price secures a decisive close above the $0.00002940 short-term moving average, a measured advance toward the next resistance at $0.00004240 becomes probable. A confirmed breakout beyond this level could extend the rally toward $0.00005790 in the mid-term, marking the next significant liquidity target. Overall, market conditions continue to align with a constructive bullish projection for LBLOCKUSD.

LBLOCK/USD – Four-Hour Chart
LBLOCKUSD maintains a bullish structure on the four-hour chart as price forms higher lows above the ascending trendline near $0.00002800. The 9-day SMA around $0.00002910 acts as dynamic support, reinforcing short-term upward momentum. The RSI currently hovers around the neutral 50 zone, suggesting sufficient room for further upside movement. A decisive breakout above $0.00002980 could propel the pair toward the $0.00004240 resistance level in the near term
Lucky Block (LBLOCK) Current Statistics
The current price: $0.00002940
Market Capitalization: $2,130,000
Trading Volume: $18,500
Do you need a coin that will 100X soon? Get LBLOCK here