Lucky Block (LBLOCK/USD) Market Displays Bullish Momentum Amid Ongoing Correction
Estimated Reading Time: 3 minutes
Don’t invest unless you’re prepared to lose all the money you invest. This is a high-risk investment and you are unlikely to be protected if something goes wrong. Take 2 minutes to learn more

Lucky Block Price Forecast – February 17
The LBLOCK/USD market displays bullish momentum amid ongoing correction. It shows promising bullish potential even as it undergoes a corrective phase.
Current market analysis reveals bullish dynamics, particularly with the Moving Average Convergence Divergence (MACD) showing slight upward momentum. The MACD line has recently crossed above the signal line, indicating a potential trend reversal. Additionally, the appearance of green histogram bars reinforces the bullish outlook. The 9-day Simple Moving Average (SMA), positioned at $0.00001540, is providing dynamic support, while the price is currently stabilizing around $0.00001570, indicating a gradual increase in buying interest.
LBLOCK/USD Market Key Levels:
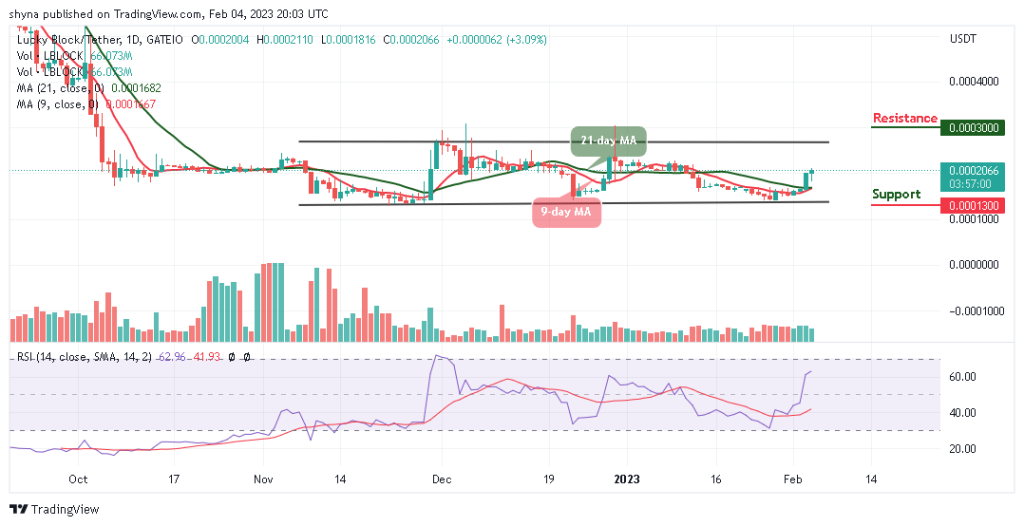
Resistance levels: $0.00001880, $0.00002490, $0.00002990
Support levels: $0.00001160, $0.00001000, $0.00000800
LBLOCK/USD – Daily Chart
The daily chart illustrates a persistent bullish order flow within the LBLOCK/USD market.
Recent price action indicates that the market has been consolidating over the past weeks, oscillating between $0.00001400 and $0.00001880. A recent attempt to break above $0.00001880 was unsuccessful, resulting in a minor pullback.
However, the indicated rectangular zone around the $0.00001400 mark serves as a significant support area, as evidenced by multiple price rebounds from this level, highlighting strong buyer interest.
 What is the market outlook of LBLOCK/USD?
 What is the market outlook of LBLOCK/USD?
The market outlook remains optimistic, with expectations for the price to retest the resistance level at $0.00001880 in the near term. A successful breakout above this threshold would potentially lead to a rally towards $0.00002490, and if bullish momentum persists, a longer-term target of $0.00002990 may be attainable. Conversely, immediate support is established at $0.00001540, with a breakdown below this level likely prompting a retest of the $0.00001400 range before any subsequent upward movements.
LBLOCK/USD – Four-Hour Chart

The four-hour chart indicates signs of a bullish continuation, as evidenced by the MACD line positioned above the signal line and the presence of green histogram bars, suggesting increasing momentum. The price has recently rebounded from the $0.00001400 support area, with the 9-day SMA at $0.00001610 providing immediate support.
Should the market surpass the $0.00001880 resistance, further upward movement toward the $0.00002490 target is likely. If buyer momentum is sustained, a subsequent rally to $0.00002990 may be expected in the near term.
Lucky Block (LBLOCK) Current Statistics
The current price: $0.00001570
Market Capitalization: $1,160,000
Trading Volume: $2,210
Do you need a coin that will 100X soon? Get LBLOCK here