Lucky Block (LBLOCK/USD) Market Double Bottom Signals Potential Bullish Reversal
Estimated Reading Time: 3 minutes
Don’t invest unless you’re prepared to lose all the money you invest. This is a high-risk investment and you are unlikely to be protected if something goes wrong. Take 2 minutes to learn more

Lucky Block Price Forecast – December 30
The LBLOCK/USD market double bottom signals potential bullish reversal. A rally is expected as the market’s selling pressure decreases in the discount zone.
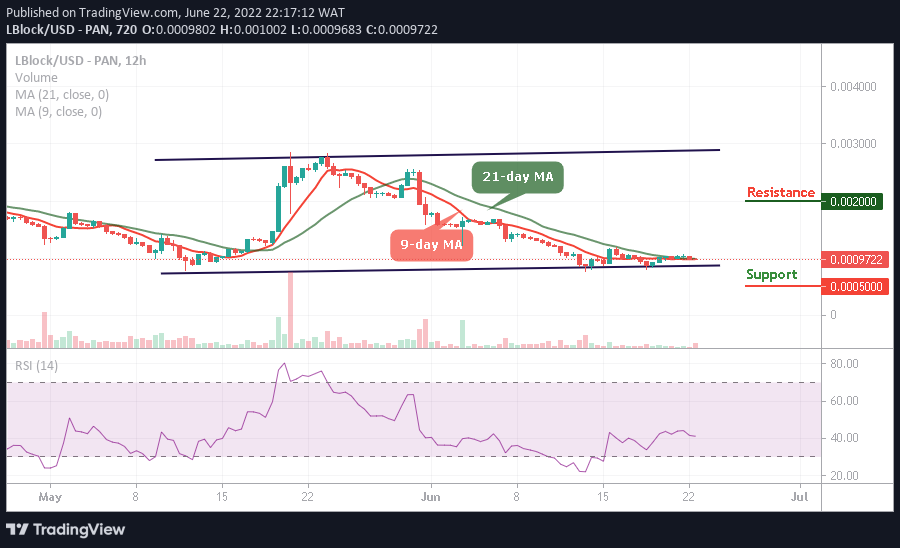
The LBLOCKUSD pair shows strong bullish potential supported by key indicators. The 9-day Simple Moving Average (SMA) at $0.00001540 is positioned below the current price, suggesting potential upward momentum. Additionally, the Relative Strength Index (RSI) hovers around 42.89, close to the oversold region, indicating the possibility of increased buying pressure. This level suggests that a reversal towards bullish sentiment may soon emerge.
LBLOCK/USD Market Key Levels:
Resistance levels: $0.00001880, $0.00002490, $0.00002990
Support levels: $0.00001410, $0.00001160, $0.00001000

LBLOCK/USD – Daily Chart
The daily chart for LBLOCK/USD shows that the market is set for a bullish move.
When the price movement is examined, the chart shows a distinct double-bottom pattern at the $0.00001160 support level. A negative trendline breakout is consistent with the pattern, suggesting that sellers are losing ground.
LBLOCKUSD also respected the horizontal resistance at $0.00001880, with a breakout above this zone likely to signal strong bullish continuation. The rejection of lower prices at $0.00001410 further confirms the strength of the demand zone.

What is expected of LBLOCK/USD in the coming days?
According to a bullish forecast, the price may soon rise towards the resistance level of $0.00002130. The next target, if momentum holds, might be the $0.00002490 zone, which is a key resistance area.
With the double-bottom formation and RSI recovery, LBLOCKUSD appears poised for an upward trend, potentially reaching $0.00002990 in the medium term. This outlook depends on continued market support and a clean breakout above the critical resistance zones.
LBLOCK/USD – Four-Hour Chart
With the price of the LBLOCKUSD pair trading close to the $0.00001410 support level, which might serve as a base for a rebound, it shows bullish potential. According to the 9-day SMA at $0.00001510, bullish momentum might be confirmed by a breakout above the declining trendline.
The market is getting close to neutral area, which allows for higher movement, according to the RSI at 44.42. In the immediate term, a successful breakout over the resistance level of $0.00001880 could push the price closer to the $0.00002130 target.
Lucky Block (LBLOCK) Current Statistics
The current price: $0.00001450
Market Capitalization: $1,150,000
Trading Volume: $962.10
Do you need a coin that will 100X soon? Get LBLOCK here