Lucky Block (LBLOCK/USD) Market Sees Bullish Momentum With Strong Potential for Growth
Estimated Reading Time: 3 minutes
Don’t invest unless you’re prepared to lose all the money you invest. This is a high-risk investment and you are unlikely to be protected if something goes wrong. Take 2 minutes to learn more

Lucky Block Price Forecast – September 30
The LBLOCK/USD market sees bullish momentum with strong potential for growth. Price currently seems to be retracing into the bullish order block. The buying pressure from the bullish order block is likely to cause a notable rise in the bullish momentum.
The LBLOCKUSD pair shows a strong bullish bias supported by technical indicators. The price is trading above the 9-day simple moving average (SMA), indicating a continuation of upward momentum. Additionally, the MACD (Moving Average Convergence Divergence) has recently turned positive, reflecting increasing buying pressure. These indicators suggest that the bulls are in control, driving the market upward.
LBLOCK/USD Market
Key Levels: Resistance levels: $0.00002490, $0.00002990, $0.00003940
Support levels: $0.00001880, $0.00001600, $0.00000930
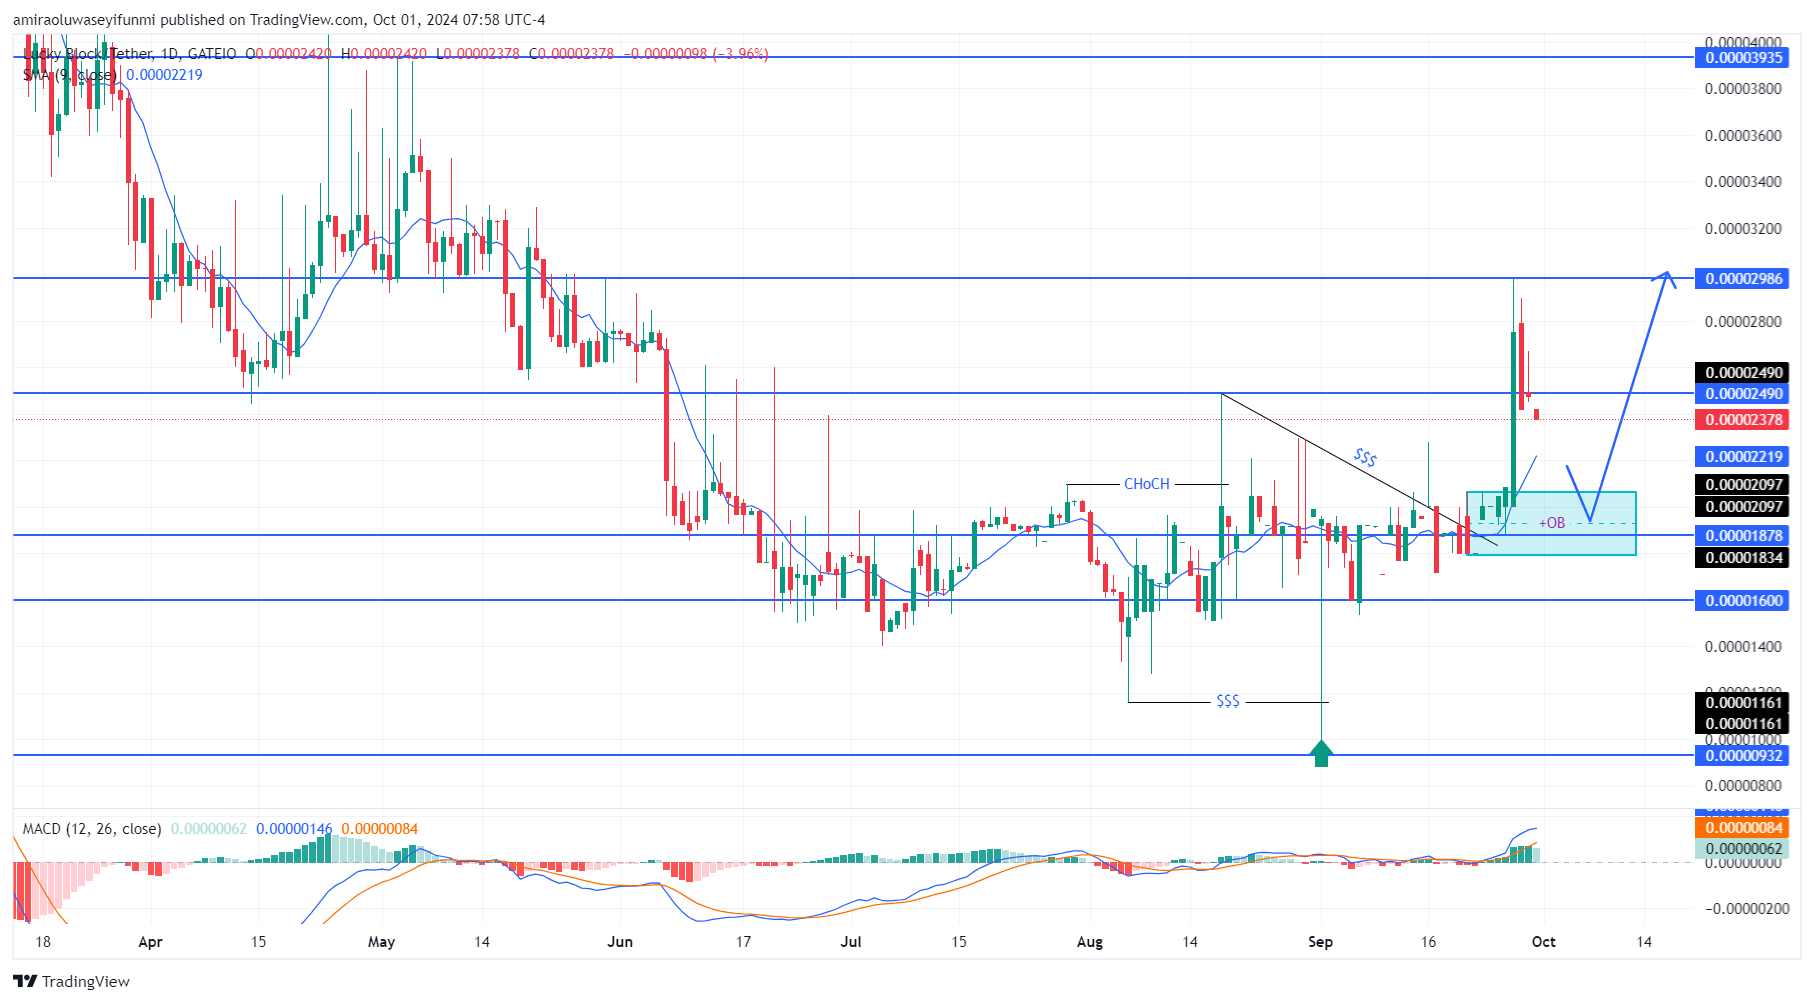
LBLOCK/USD – Daily Chart
The daily chart for LBLOCK/USD shows an increase in the buying momentum.
LBLOCKUSD broke out of a key descending trendline around $0.0000220, confirming the bullish trend. The breakout above the $0.0000210 resistance level further validated the uptrend. Despite a brief pullback, the price continues to respect the $0.0000220 support, and the recent higher high around $0.0000250 confirms the bullish structure.
What is expected of LBLOCK/USD in the coming days?
Looking ahead, the market is likely to target the next major resistance at $0.00002990. Before reaching this level, LBLOCKUSD might experience a retest of the $0.0000220 zone for consolidation. If the bulls maintain control, a break above $0.00002990 could see the pair heading toward the $0.00003940 resistance level in the longer term.
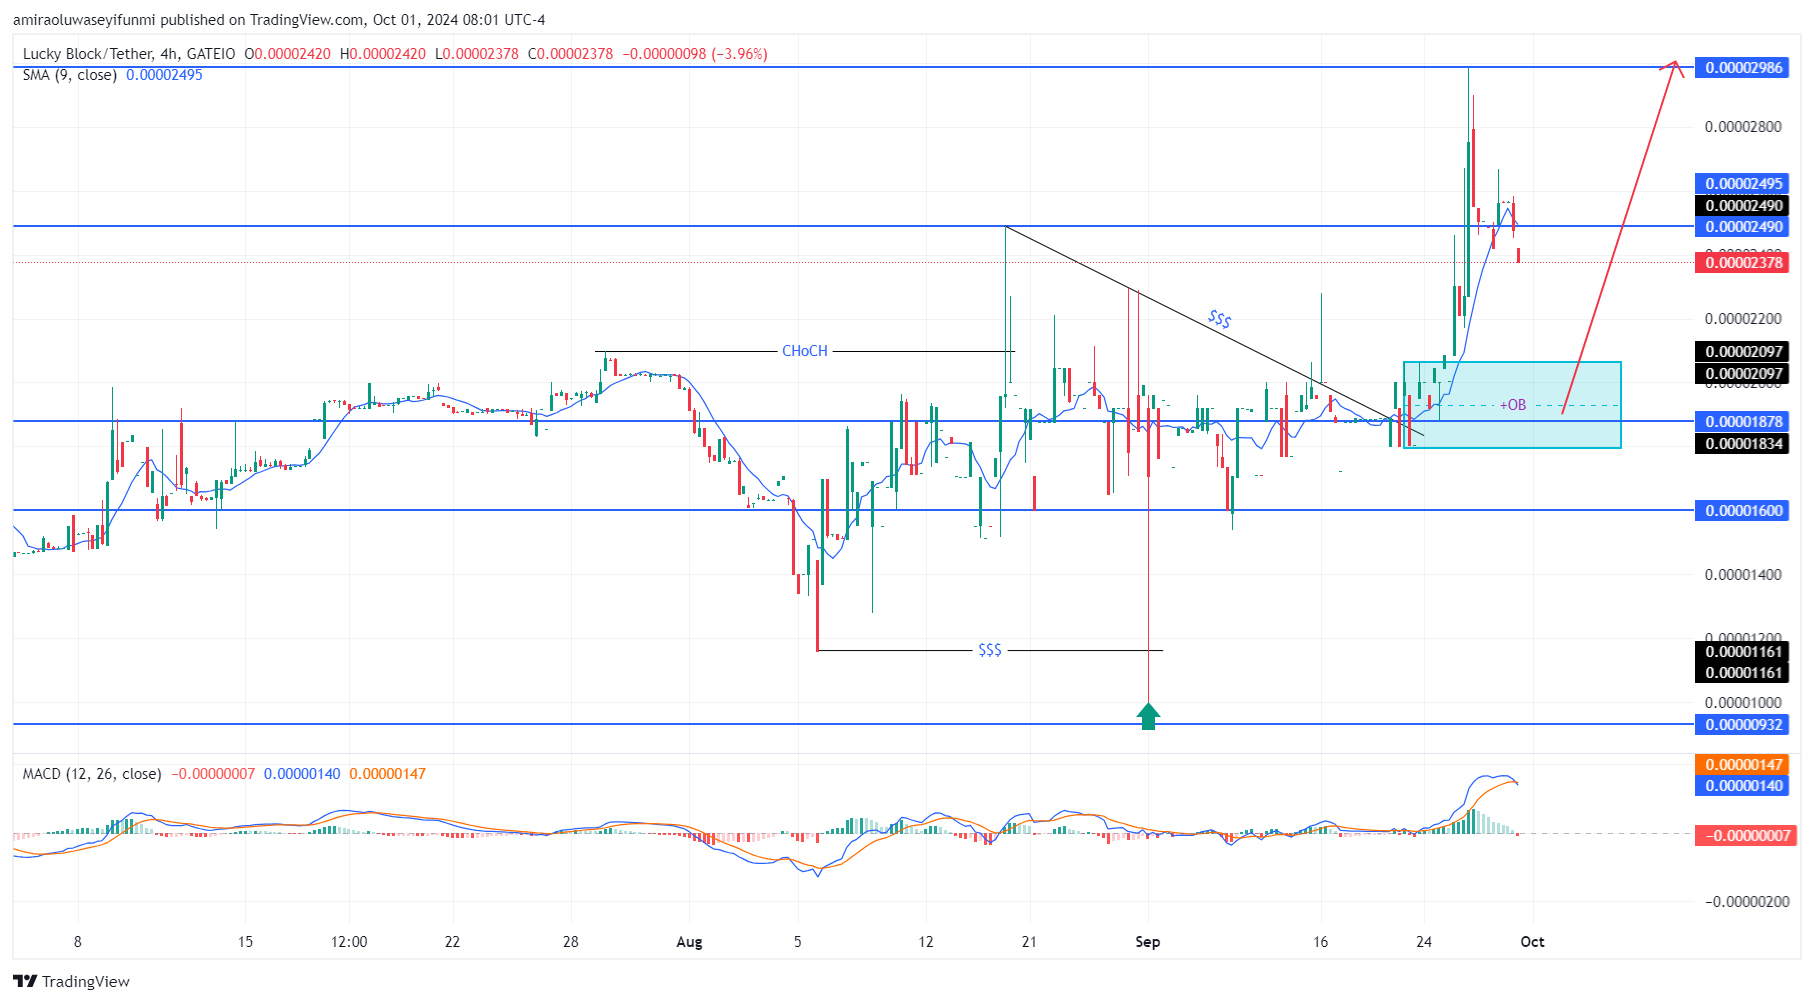
LBLOCK/USD – Four-Hour Chart
The direction of LBLOCKUSD is bullish on the 4-hour chart as the price has broken above the recent resistance at $0.00002490. A bullish market structure is evident with a clear break of the change of character (CHoCH) and a retest of the order block (OB) at $0.00002100, which acts as support.
The MACD (Moving Average Convergence Divergence) shows a bullish crossover, confirming momentum in favour of the buyers. LBLOCKUSD is likely targeting the next resistance level at $0.00002990.
Lucky Block (LBLOCK) Current Statistics
The current price: $0.00002380
Market Capitalization: $1,980,000
Trading Volume: $1410
Do you need a coin that will 100X soon? Get LBLOCK here