Lucky Block (LBLOCK/USD) Market Shows Strong Bullish Momentum After Trendline Breakout
Estimated Reading Time: 3 minutes
Don’t invest unless you’re prepared to lose all the money you invest. This is a high-risk investment and you are unlikely to be protected if something goes wrong. Take 2 minutes to learn more

Lucky Block Price Forecast – February 3
Lucky Block market shows bullish momentum amid key technical indicator signals. Following the completion of the short-term retracement, LBLOCKUSD is expected to resume its bullish trend at $0.00001370.
The Simple Moving Average (SMA) (9, close) at $0.00001560 is positioned near the current price level, indicating short-term consolidation before a potential breakout. The MACD (12, 26, close) histogram shows a gradual increase in green bars, signalling bullish momentum gaining strength. The MACD line appears to be converging above the signal line, which is a bullish crossover signal. If this trend continues, it could further reinforce buyer confidence and lead to upward price movement.
LBLOCK/USD Market Key Levels
Resistance levels: $0.00001880, $0.00002490, $0.00002990
Support levels: $0.00001370, $0.00001160, $0.00001000
LBLOCK/USD – Daily Chart
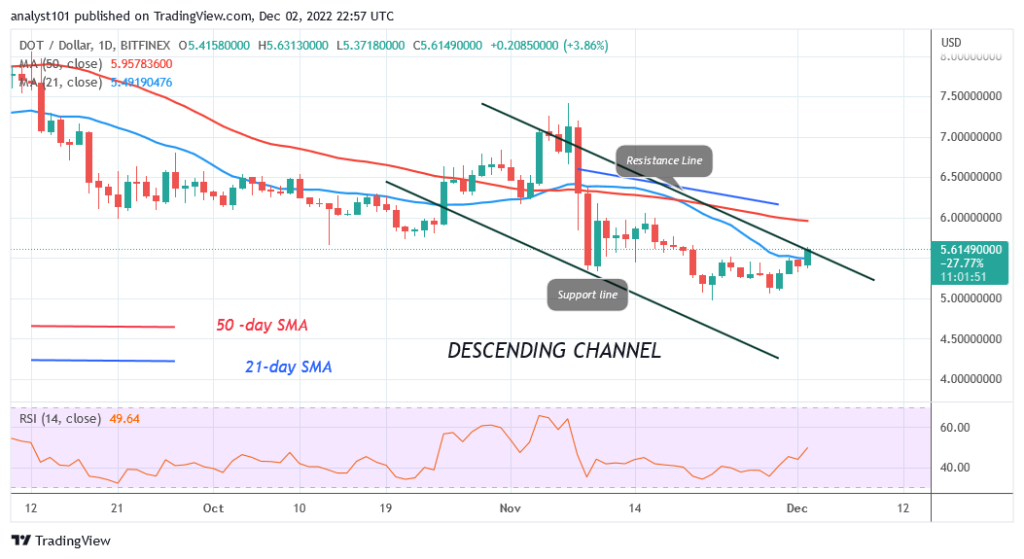
The daily chart for LBLOCK/USD shows that the market is undergoing a minor retracement to the downside.
LBLOCKUSD has been trading within a range, respecting the support level at $0.00001160 and facing resistance near $0.00001870. A descending trendline breakout has occurred, suggesting a shift in momentum from bearish consolidation to bullish activity.
Additionally, the price has maintained a series of higher lows, which aligns with an accumulation phase. If this structure holds, the market could be preparing for a strong upward movement toward the next resistance.

What Is Expected of BLOCK/USD in the Coming Days?
Based on the current trend, LBLOCKUSD is expected to test the $0.00001870 resistance level in the short term. If a successful breakout occurs, the next target could be around $0.00002490, where the previous major resistance was established.
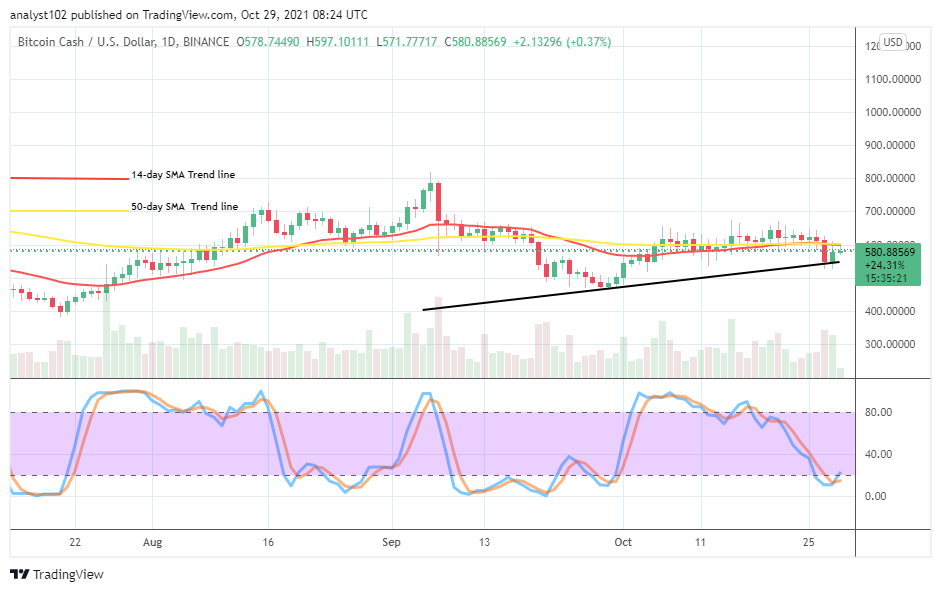
 LBLOCK/USD – Four-Hour Chart
LBLOCKUSD has broken out of a descending trendline and is now consolidating above $0.00001470. The 4-hour order block (OB) zone between $0.00001160 and $0.00001470 will likely act as a strong demand area, triggering the current upward move.
The SMA (9, close) at $0.00001600 is slightly above the price, suggesting a brief pullback before continuation. If buyers sustain momentum, the next key resistance at $0.00001880 could be tested, with a potential upside toward $0.00002490.
Lucky Block (LBLOCK) Current Statistics
The current price: $0.00001530
Market Capitalization: $1,950,000
Trading Volume: $82.90
Do you need a coin that will 100X soon? Get LBLOCK here