OFFICIAL TRUMP (TRUMP/USDT) Faces Strong Sell-Off as Key Support Levels Tested
Estimated Reading Time: 3 minutes
Don’t invest unless you’re prepared to lose all the money you invest. This is a high-risk investment and you are unlikely to be protected if something goes wrong. Take 2 minutes to learn more

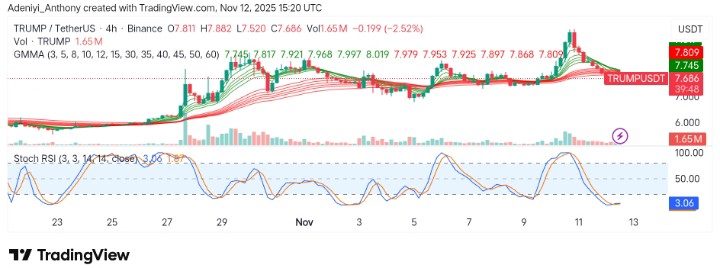
Activities in the market for Official Trump against Tether on both the 24-hour and 4-hour timeframes have turned out to be bearish, recording declining value since yesterday. As it stands, the pair has gone down by 5.65% in the last 24 hours, operating slightly below the $8.00 level. Meanwhile, the drastic fall in value appears to be great when considered on the 4-hour chart, as the $9.50 quickly turned to $7.75 in eleven sessions.
Currently, the Guppy Multiple Moving Averages (GMMA) and the stochastic RSI across daily and 4H time zones suggest the pair is ranging as the price appears to be stuck between $7.69 and $7.80, moving down by 1.60% as of today.
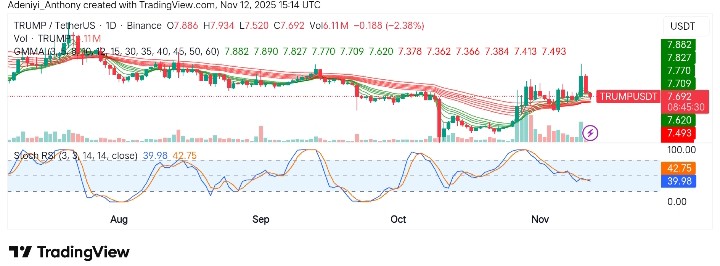
Technical Indicators
Major Resistance Levels: $7.90, $8.30, and $9.50
Major Support Levels: $7.50, $7.00, and $6.60
Technical Analysis
On the daily timeframe, the official Trump against Tether seems to have recorded a massive gain some sessions ago. However, the gains appear to have been eroded as the pair now moves 1.55% below the previous depth. Meanwhile, the GMMA on one side displays that the pair for some period has not seen a surge in recent times, while the Stochastic RSI moves on a straight line.
To this end, for the pair to recover from the prolonged fall in price, a break above $9.00 must be seen with increased volume; otherwise, the trend continues.
$TRUMP just broke out of the Falling Wedge.
This is a trend reversal signal not noise.
Momentum is shifting.
Buyers are stepping in.
Pressure is building.Bullish. pic.twitter.com/G1bfKj7fZe
— CAI SOREN (@Cai_Soren) November 11, 2025
Meanwhile, @Cai_Soren have detected that Trump is breaking the wedge for a move to the north. The analyst opined that a high pump may be seen once a breakout is confirmed.
TRUMP/USDT Analysis: Can a Bounce Be Seen?
On the 4h chart, TRUMP/USDT seems to be halting bearish pressure as a slight gain is spotted on the chart. The pair, though operating nearly at the bottom of the clusters of exponential moving averages, seems to be gearing for a northbound journey.
From another angle, the Stochastic RSI, which lies in the oversold region, shows that the pair is preparing a move upside. However, the momentum appears to be too low for now; an increase in the participatory level is needed for the potential upside move.
You can purchase crypto coins here. Buy Crypto