Orchid (OXT/USD) Completes a Full Market Cycle
Estimated Reading Time: 3 minutes
Don’t invest unless you’re prepared to lose all the money you invest. This is a high-risk investment and you are unlikely to be protected if something goes wrong. Take 2 minutes to learn more
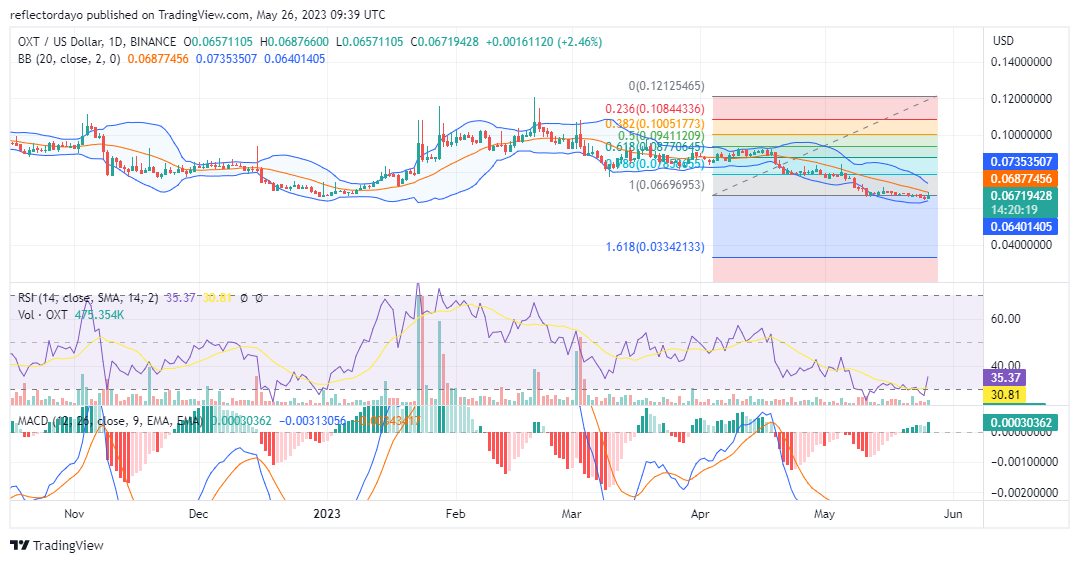
The Orchid market has completed a full market cycle by retracing back to the low of January 1. This level, the $0.0667 price level, has been the major baseline for the market since the beginning of the year. Between the latter part of January and early March, the market continuously tested price levels above the $0.11 price level but failed to break through. That resistance level became the point of the downturn for the market.
OXT Market Data
- OXT/USD Price Now: $0.67
- OXT/USD Market Cap: $64,519,968
- OXT/USD Circulating Supply: 963,629,239 OXT
- OXT/USD Total Supply: 1,000,000,000
- OXT/USD Coinmarketcap Ranking: #333
Key Levels
- Resistance: $0.10, $0.11, and $0.12.
- Support: $0.55, $0.50, and $0.45
Price Prediction for Orchid: The Indicators’ Point of View
After bull market was rejected at the $0.11 price level, the market became tense due to the struggle between demand and supply. Orchid experienced some erratic price ranges around the $0.10 price level. But as the volatility cools off, the market settles into the $0.9 and $0.8 price zones. It started retracing the January low on April 19. Currently, it has covered up to 100% of the Fibonacci retracement level. Therefore, an upside market rebound is most likely to play out in the market. That is exactly what we are seeing in today’s market. The market is heading a bullish direction. Although the Bollinger Bands still illustrate a downward or sloppy price channel, both the Relative Strength Index (RSI) and the Moving Average Convergence and Divergence (MACD) hold to a bullish market recovery.
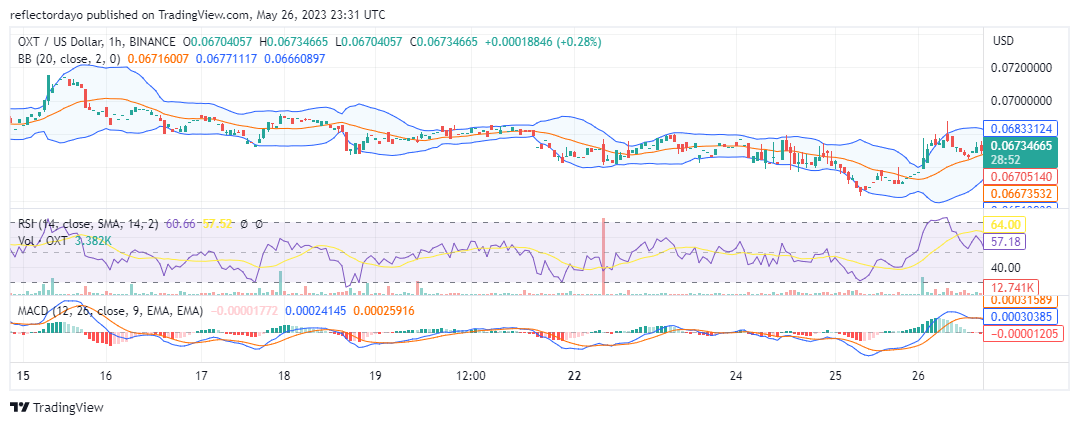
OXT/USD 4-Hour Chart Outlook
From the standpoint of a 4-hour chart outlook, we can see that the recovering market is facing the $0.0678 resistance level. Bulls have started to test this resistance, and that means they stand a chance of breaking it. According to the Relative Strength Index (RSI), the bullish rush was so aggressive that the RSI line is almost appearing in a vertical rise. In some cases, such a market rise will result in a sharp retracement. This could be beneficial for buyers as long as this sharp rise has not taken the market into the overbought zone, because if the buying continues to pump with aggression, the market may venture into the overbought zone, and that can affect the bullish recovery. The uptrend will continue as the overall bullish sentiment is still on the rise.