POL (ex-MATIC) Price Prediction: POL/USDT Price Action Sees Moderate Upside Recovery
Estimated Reading Time: 3 minutes
Don’t invest unless you’re prepared to lose all the money you invest. This is a high-risk investment and you are unlikely to be protected if something goes wrong. Take 2 minutes to learn more

POL (ex-MATIC) Price Prediction (February 15):
Price action in POL (ex-MATIC) has started retracing its steps upward ever since the market hit the long-term support level of $0.2900. However, this movement has been minimal and appears largely vulnerable to a continued downward retracement.
POL/USDT Long-Term Trend: Bearish (Daily Chart)
Key Price Levels:
Resistance: $0.4000, $0.5000, $0.6000
Support: $0.4500, $0.4000, $0.3500
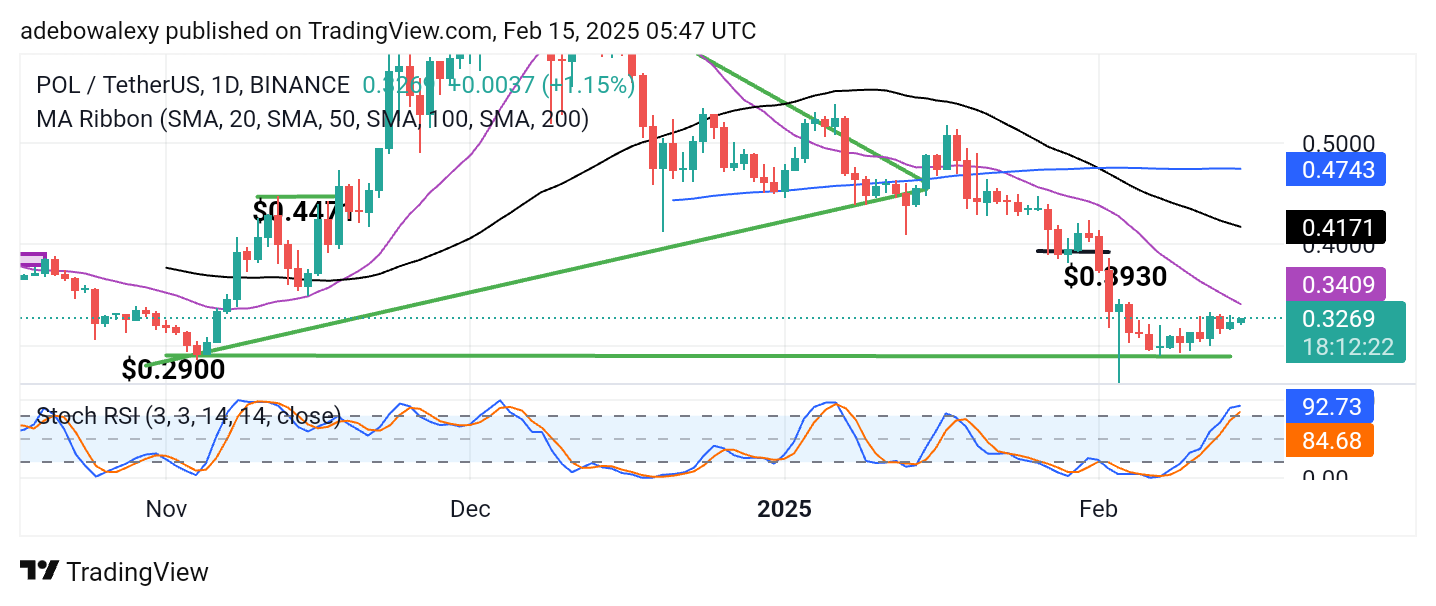
The ongoing session is marked by a green price candle. Although price action remains below all the Moving Average (MA) lines, we can see that it is steadily moving toward them. Meanwhile, the Stochastic RSI lines retain a gentle upward trajectory toward the oversold region. However, it should be noted that the Stochastic Relative Strength Index (RSI) lines show a deflection in the lead line.
POL (ex-MATIC) Price Prediction: POL/USDT Stays in Bearish Territory
While the POL (ex-MATIC) market has experienced some recovery, a broader view suggests that price action remains vulnerable. This view stems from the fact that price activity remains below all the MA lines.
Additionally, the movement of the Stochastic RSI indicator appears somewhat exaggerated, as it has risen past the 70 mark despite the moderate recovery. Although the ongoing session remains bullish, the lead line of the indicator shows a deflection, dampening hopes for a strong upside correction in this market.
POL (ex-MATIC) Price Prediction: POL/USDT Bullish Sentiment Strengthening (4-Hour Chart)
Looking at the POL (ex-MATIC) 4-hour chart, it appears that the upside retracement may be securing some key levels. Here, price action has risen past the 20- and 50-day MA lines, while the market is drawing closer to the 100-day MA curve from below. Additionally, the Stochastic RSI curve maintains a slight upward path and has moved past the 50 level of the indicator.
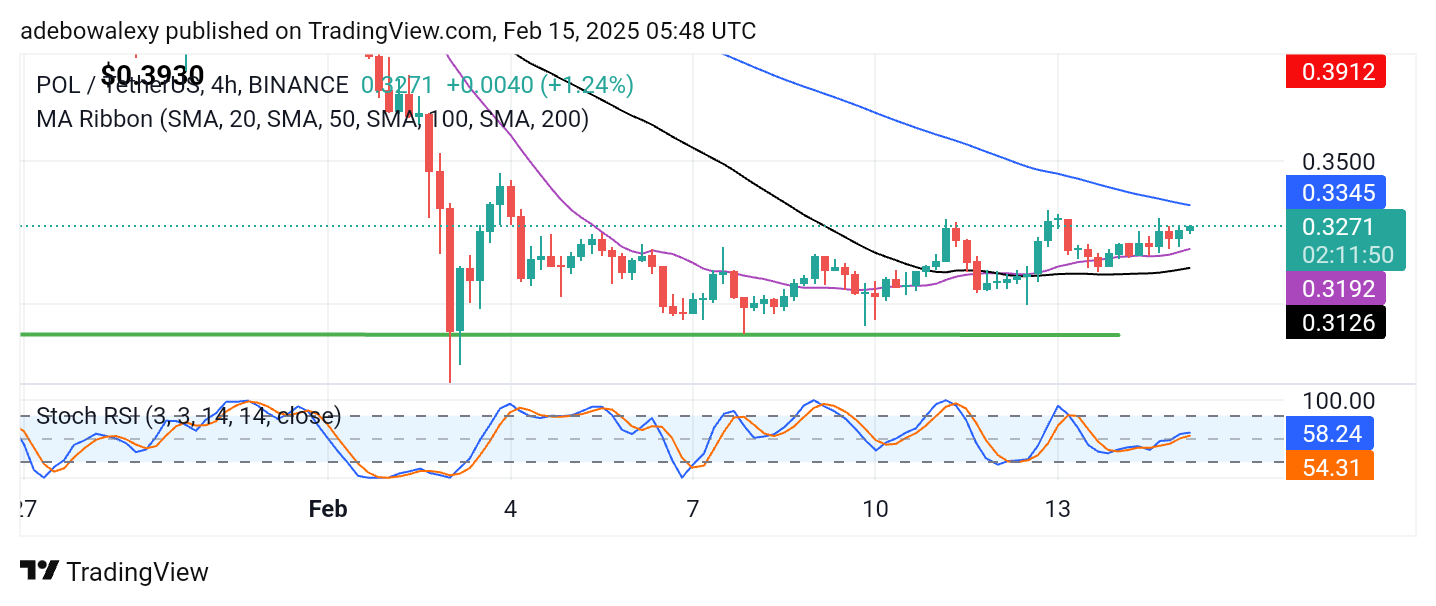
Technically, one can deduce that price behavior indicates a short-term upward trajectory. The fact that price action has surpassed the 20- and 50-day MA curves while the 100-day MA remains below the $0.3500 price level suggests that market participants may be targeting the $0.3500 price level in the near term.