POL (Prev. MATIC) Price Prediction: POL/USDT Pokes Through the $0.1000 Baseline and Rebounds Afterwardso
Estimated Reading Time: 3 minutes
Don’t invest unless you’re prepared to lose all the money you invest. This is a high-risk investment and you are unlikely to be protected if something goes wrong. Take 2 minutes to learn more

Date: January 3, 2026
The POL (Prev. MATIC) market has been on a long-term downward correction. Over this period of time, the market saw a strong bearish move. However, the market took an unexpected U-turn as soon as it fell below the $0.1000 level. That trend stays largely ongoing by technical standards as of the moment.
POL/USDT Long-Term Trend—Bullish (Daily Chart)
Key Price Levels:
Resistance: $0.1250, $0.1500, $0.1750
Support: $0.1000, $0.0850, $0.0700
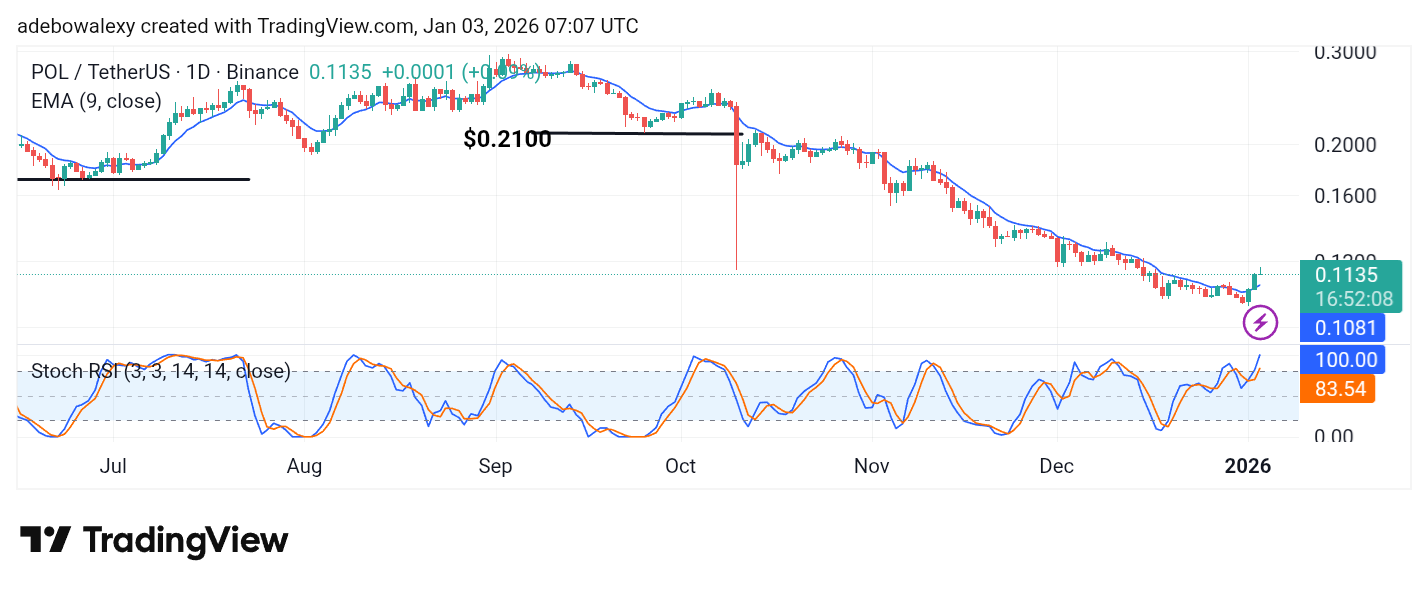
The POL (Prev. MATIC) market on the 24-hour chart stays largely bullish as of the moment. The ongoing session seems quite compressed but stays green by the wicks. Also, the mentioned price candle remains above the 9-day Exponential Moving Average (EMA) line. Likewise, the Stochastic Relative Strength Index (SRSI) indicator lines are shaped to tilt sharply upward in the overbought zone of the indicator.
POL/USDT Price Prediction: POL (Prev. MATIC) May Edge Higher (Daily Chart)
The current session has come under strong bearish pressure as of the moment. However, the POL (Prev. MATIC) market can still be considered bullish, considering its technical standpoint. The token continues trading above the 9-day EMA curve.
The Stochastic RSI indicator lines are also rising steeply upward into the overbought zone. As such, this matches the bullish consistency displayed by the last three price candles on this chart. Therefore, this market can be said to be staying largely on course toward higher ground, despite the seen rejection off the $0.1170 threshold level.
POL/USDT Price Prediction: POL (Prev. MATIC) Hits a Rejection at the $0.1170 Threshold (4-Hour Chart)
On the POL (Prev. MATIC) 4-hour price chart, one can see that a red price candle has appeared off the resistance level at $0.1170. Likewise, it has almost wiped out all the gains presented by the previous session.
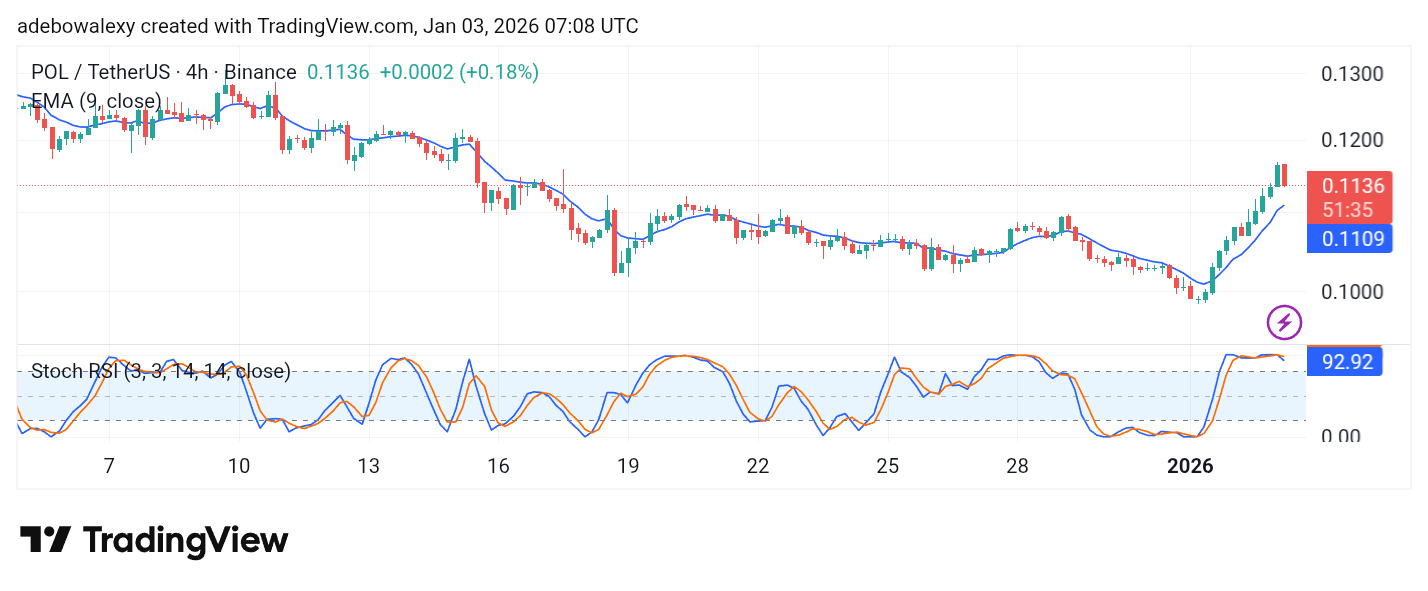
Nevertheless, trading remains above the 9-day EMA curve. Also, the SRSI indicator lines remain above the 80 mark of the indicator.
However, the terminal part of the indicator lines seems to have a slight downward bearing due to the current appearance of the last price candle on the chart. Nevertheless, this market has the technical grounds to proceed toward the $0.1250 level for short-term gains.