Pump.fun Demonstrates Resilience Around 2026 Demand Zone
Estimated Reading Time: 3 minutes
Don’t invest unless you’re prepared to lose all the money you invest. This is a high-risk investment and you are unlikely to be protected if something goes wrong. Take 2 minutes to learn more

Pump.fun price has extended its weekly decline to 23% following a 2.29% dip over the last 24 hours. This downturn appears to be primarily driven by a 1.9% contraction in the global crypto market cap, leading to a massive downtrend in the altcoin market.
Furthermore, it appears that more pressure seems to be stemming from a technical resistance level at $0.0034. This has triggered widespread stop-loss orders. Combined with an extreme fear sentiment rating of 14. At the moment, investor risk appetite remains low, fueling continued bearish momentum across the ecosystem.
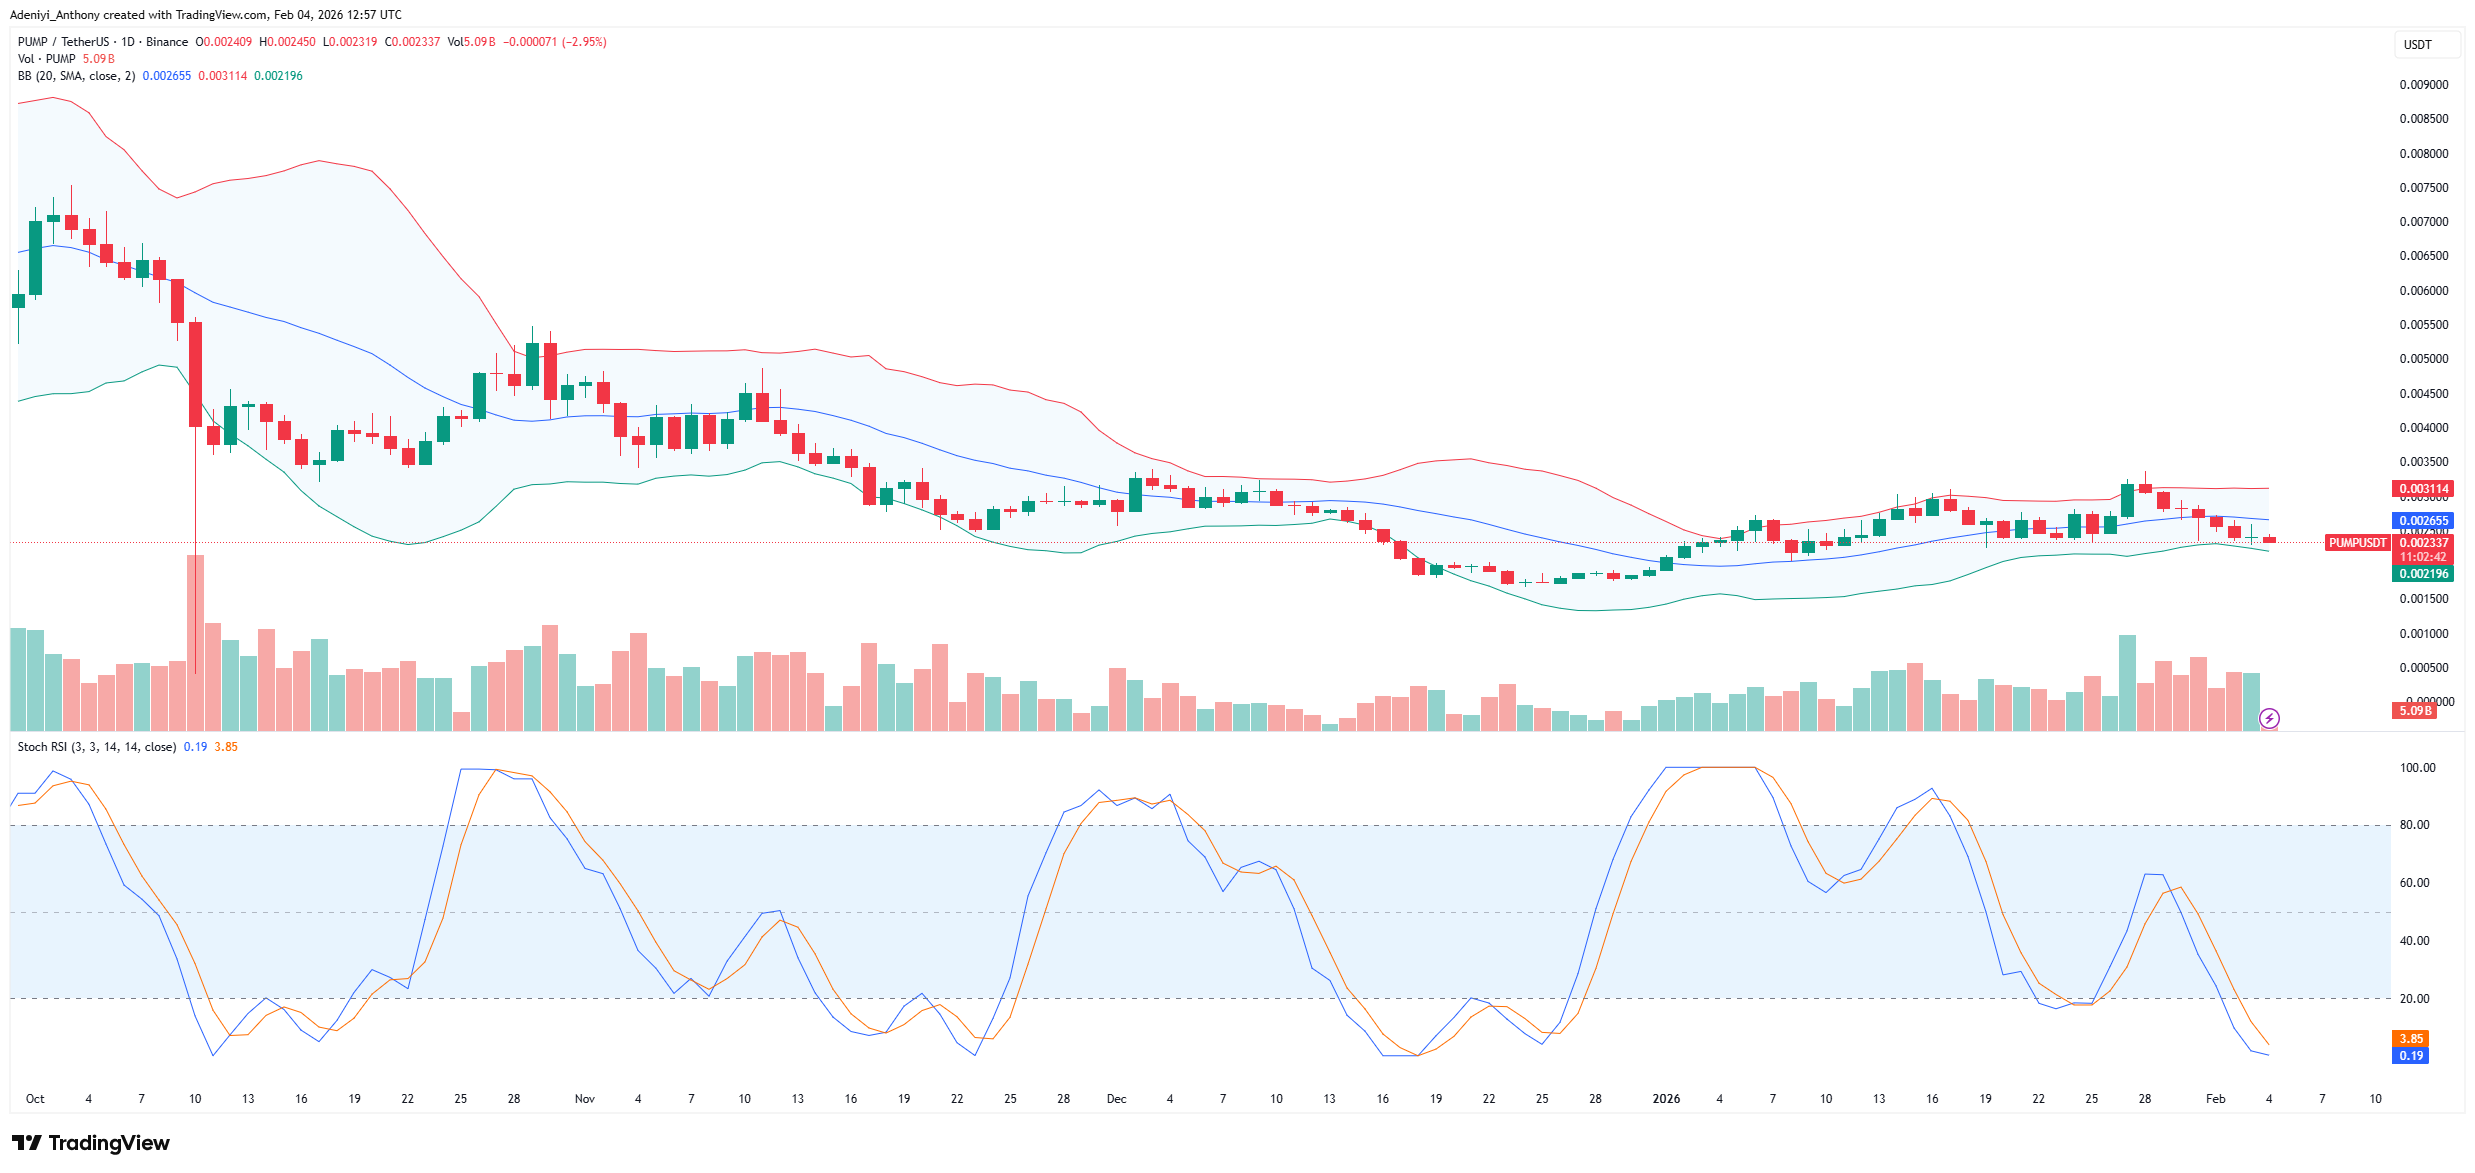
Currently, Pump.fun trades at $0.002337 with over 5.09 billion traded volumes on the daily timeframe.
Technical Indicators
Major Resistance Levels: $0.00259, $0.00313, and $0.00325
Major Support Levels: $0.00228, $0.00200, and $0.00180
Technical Analysis
Technically, Pump.fun against Tether appears to be exhibiting classic sideways movement on the daily chart. The pair is moving within a collapsed band as the Pump.fun price operates right above the lower Bollinger line. This suggests the token is oversold as the participatory level rises.
Additionally, signals from the Stochastic RSI show that the pair is extremely oversold, with the lines positioned lower than the 20-mark level. However, the behavior of the lines suggests there might be a relief bounce above $0.002590 that may be spotted soon.
Meanwhile, a post from X from @DegenMemeCalls reports that pump.fun has reached nearly 300,000 daily active wallets, which seems to be driving a surge in Solana meme coin activity. To this end, the analyst opined that this growth, marked by high token creation and record buybacks, may indicate a rebound in platform dominance. It was suggested that this action may renew investor enthusiasm within the crypto ecosystem.
https://t.co/b0Bh55ZusJ hits nearly 300K daily active wallets, leading a surge in Solana meme coin activity. New wallets, high token creation, and record buybacks signal renewed crypto enthusiasm and platform dominance rebound. pic.twitter.com/NX54zOOUXR
— Degen Meme Calls (@DegenMemeCalls) February 4, 2026
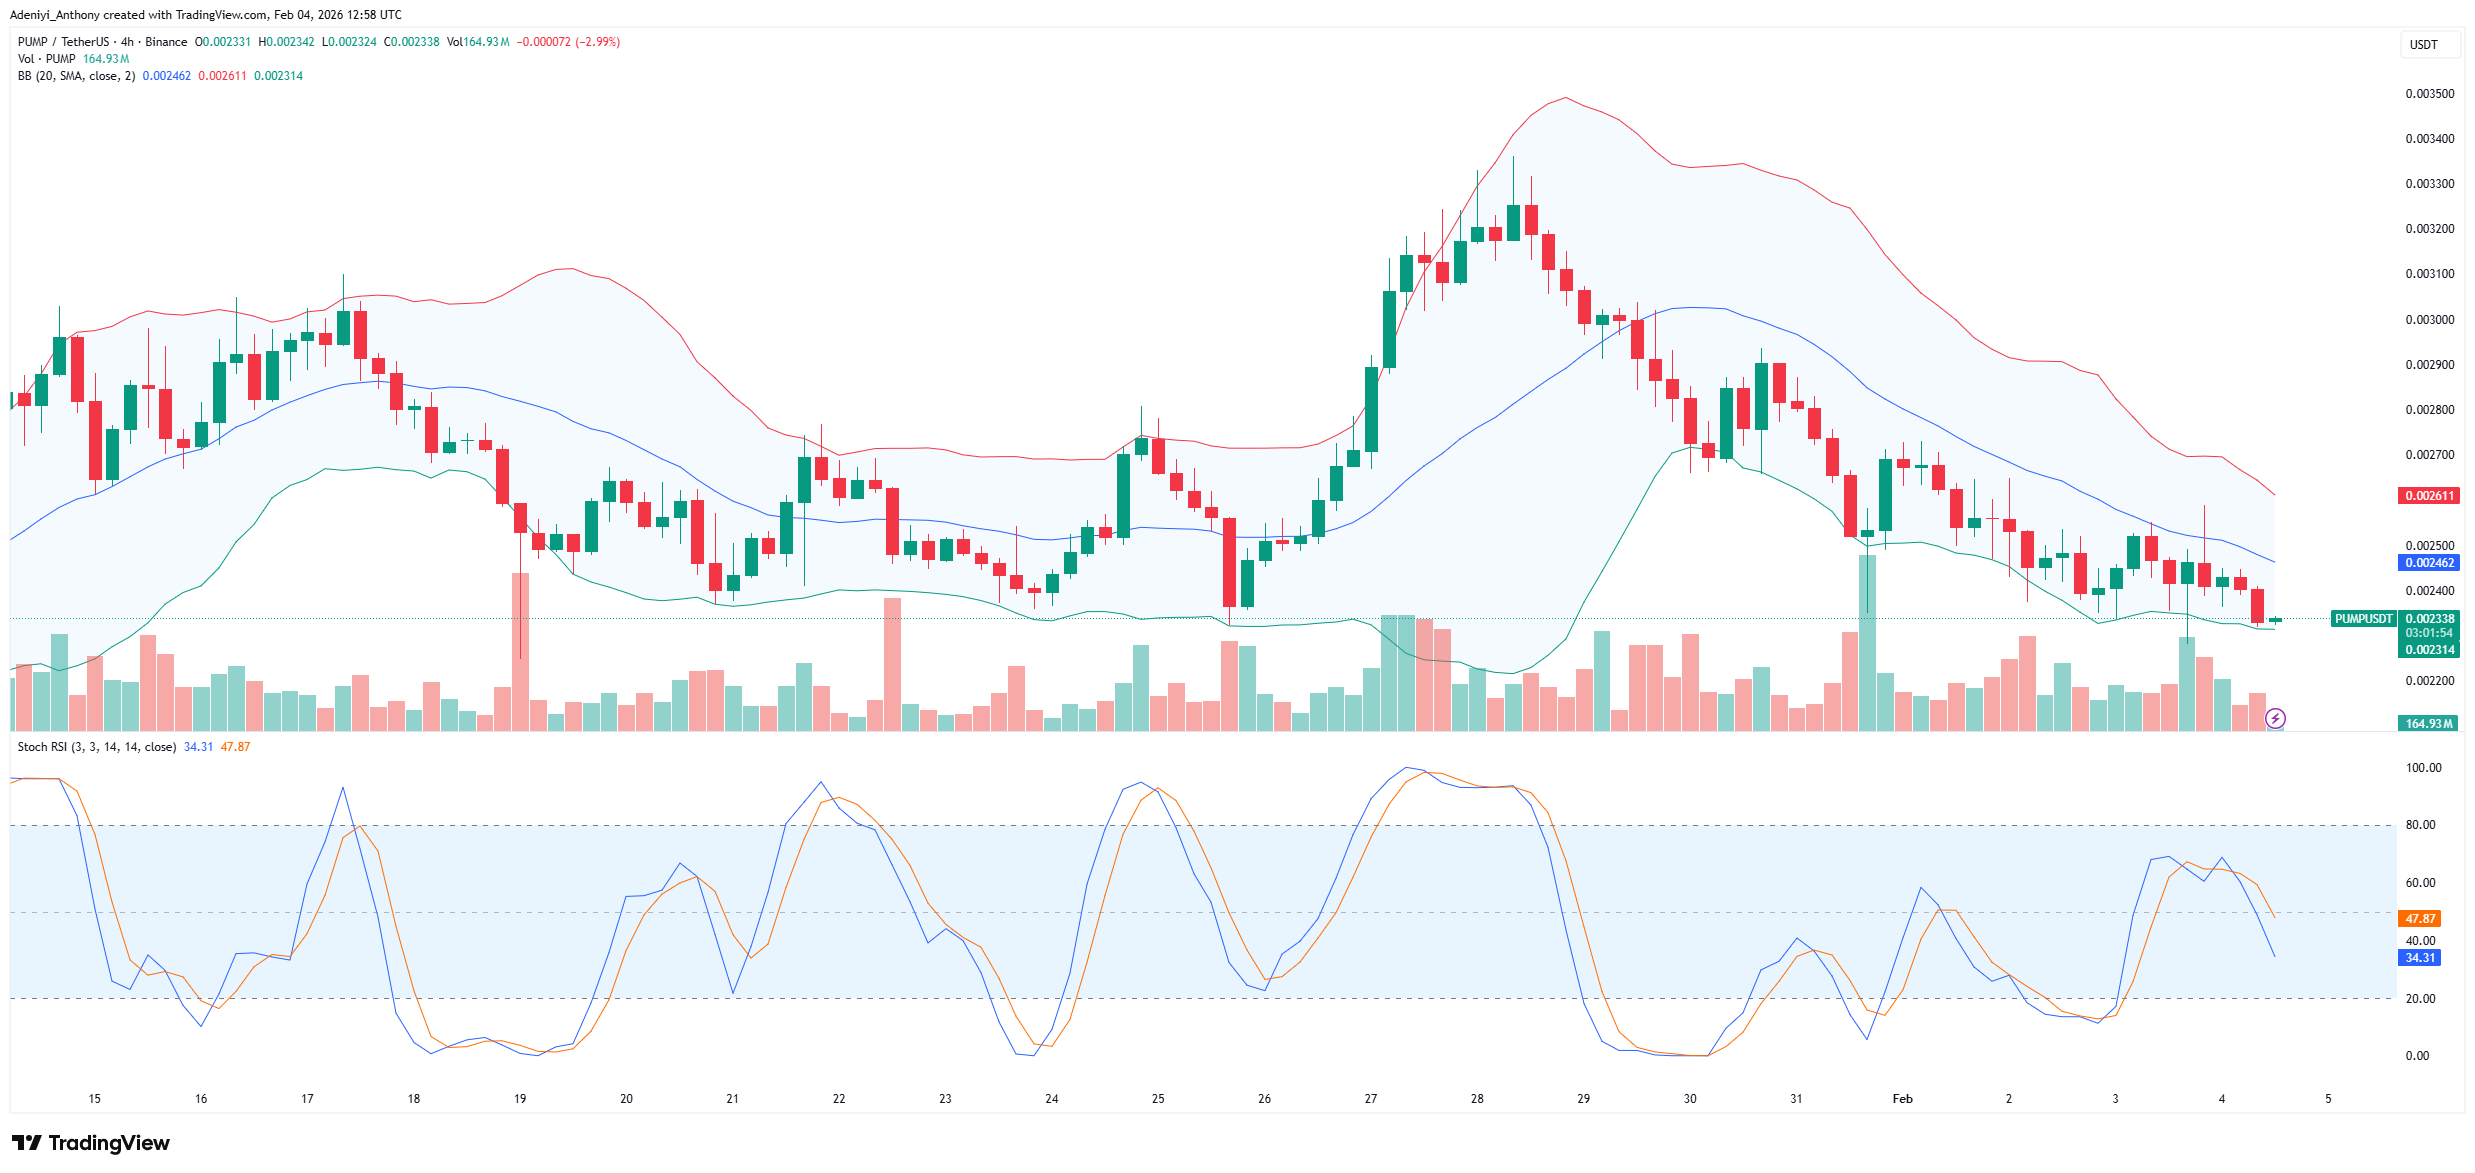
PUMP/USDT Analysis: Pump.fun Price Action Suggests Impending Breakout
PUMP/USDT on the 4H chart displays an obvious trend with the Pump.fun price tending to the south after a failed attempt around $0.00300 weeks ago. As it stands, the directional indicator suggests more movement in the current direction in the coming days. However, current price action suggests that buyers need to increase their involvement or maintain the current level to change the tide.
Meanwhile, the momentum oscillator beneath the chart signals increasing selling pressure as the lines drop sharply in the 40-30 mark level. To this end, if momentum is not stabilized, Pump may not be able to stay above the current demand zone.
You can purchase crypto coins here. Buy Crypto

