Quant (QNT) Hits a Strong Wall at $300
Estimated Reading Time: 3 minutes
Don’t invest unless you’re prepared to lose all the money you invest. This is a high-risk investment and you are unlikely to be protected if something goes wrong. Take 2 minutes to learn more

- QNT surged from $60 to $228 but faced rejection at $300.
- SRSI shows a bearish crossover, while QNT remains above the 9-day EMA.
- QNT could retest $300 if bullish momentum returns.
While most analysts are of the opinion that Quant has gone parabolic, it appears that the upside forces have faced rejection at the $300 level. However, it is crucial for us to understand how this market may behave from this point on. Let’s explore the details below.
QNTUSDT on a 24-Hour Chart
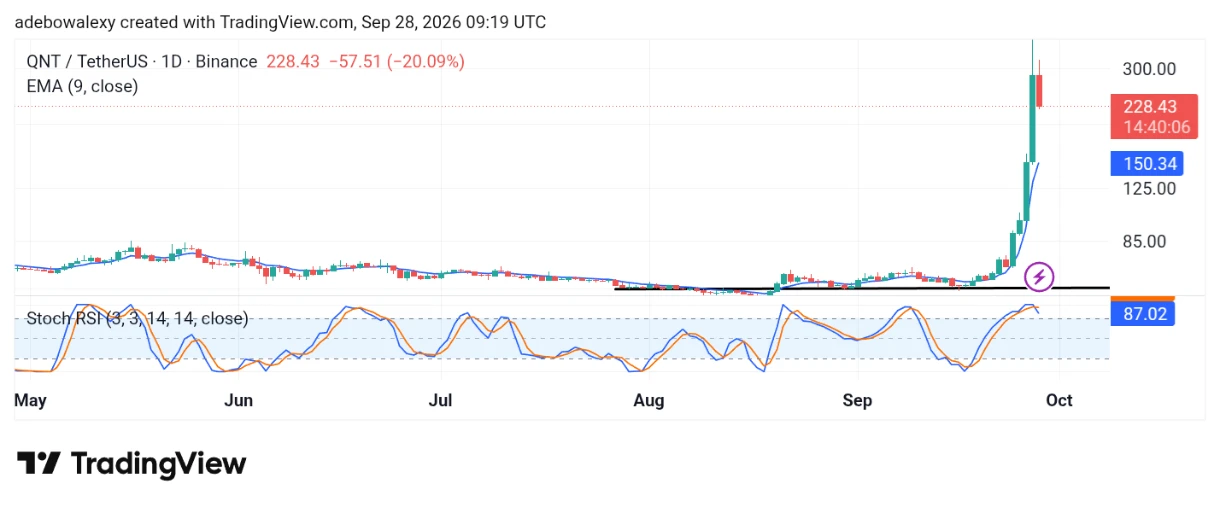
On the daily Quant price chart, we can see that price action has exploded off the $60 baseline. This resulted after price action delivered a double bottom at the mentioned support level.
However, at this point, the market has seen a pullback following the massive pump, but the token continues to trade above the 9-day Exponential Moving Average (EMA) line.
Also, the token is still worth $228 as of the time of writing. The Stochastic Relative Strength Index (SRSI) indicator lines are in the overbought region but have delivered a downward crossover there, which accounts for the pullback.
The Quant Market Soaks in Some Rejection but Retains Buoyancy
The price of the QNT token has indeed seen some massive upward movement over the past four sessions. As such, this has given bulls the capacity to absorb some pressure from a downward pullback. The latest price candle has presented a pullback from the psychological resistance at the $300 level.
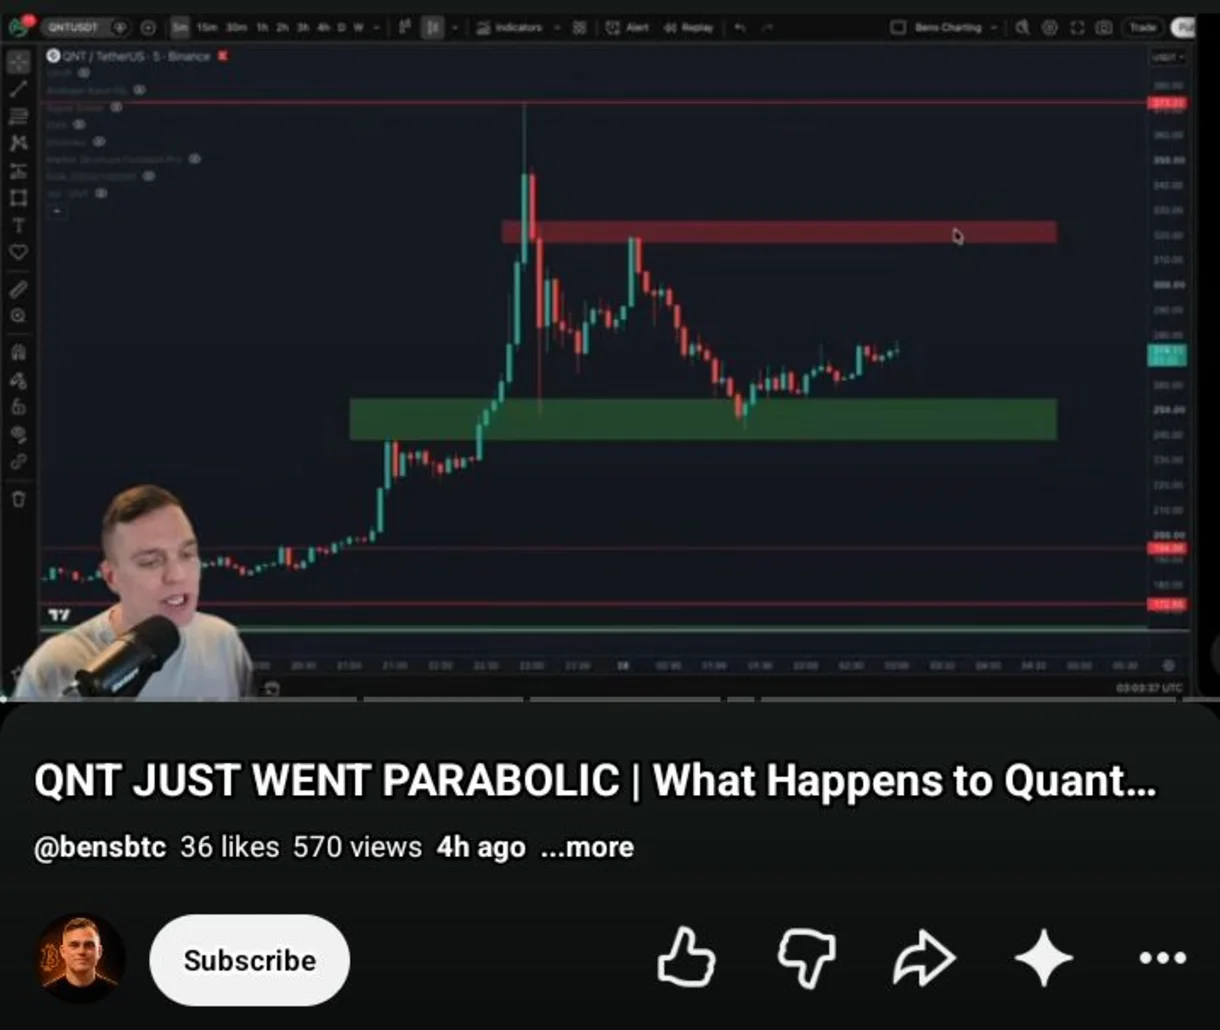
It can be observed that the price level appears to be a strong resistance, as price action has not been able to breach the mentioned level. The SRSI has delivered a downward crossover, but the lines are still in the overbought region. Considering the fact that trading activity remains above the 9-day EMA curve, upside forces may still have an opportunity to make a comeback.
QNT Will Still Challenge the $300 Resistance
The Quant market has indeed seen massive price growth. Even now, with the token price up from $60 to $228 as of the latest reading, a buyer at $60 would have a 280% gain. This seems quite impressive. Furthermore, since trading remains above the 9-day EMA curve, upside forces may resume, prompting a revisit of the $300 resistance level.