Ripple Is in a Range but Struggles below the $0.48 High
Estimated Reading Time: 2 minutes
Don’t invest unless you’re prepared to lose all the money you invest. This is a high-risk investment and you are unlikely to be protected if something goes wrong. Take 2 minutes to learn more
Ripple (XRP) Long-Term Analysis: Bearish
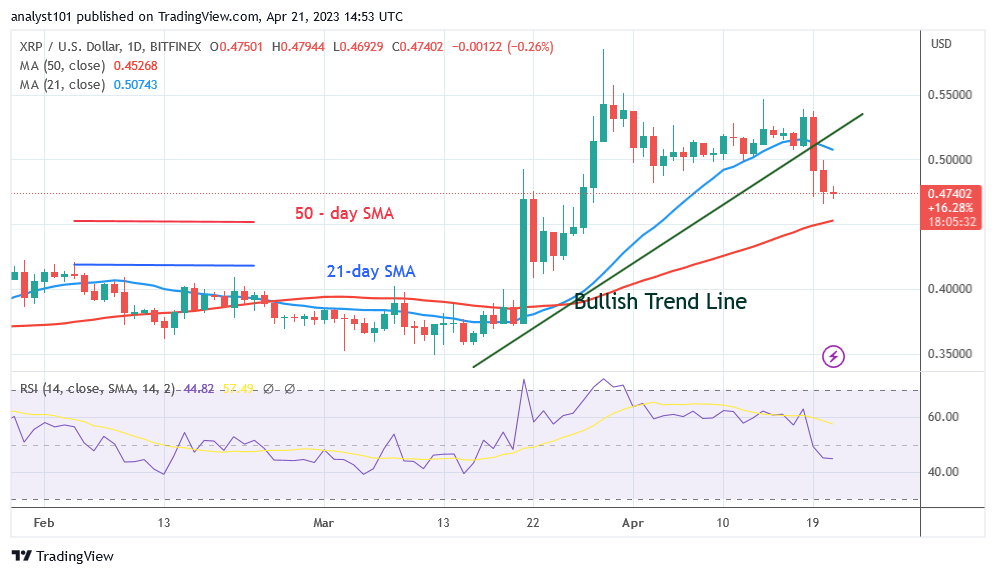
Ripple’s (XRP) price has reached the bearish trend zone but struggles below the $0.48 high. Although the cryptocurrency asset is trading in between the moving average lines, it has dropped below the moving average lines but pulled back above the 50-day SMA. XRP is currently trading for $0.47 at the time of writing. At this time, XRP is confined between the moving average lines. The crypto asset will thus be compelled to move range-bound between the moving average lines. The market will trend when the moving average lines are breached. The bearish momentum has decreased now that the cryptocurrency is contained within the moving average lines. The XRP price will restart its positive trend if it crosses above the 21-day SMA. The scenario changes when the price closes below the 50-day SMA.
Ripple (XRP) Indicator Analysis
Ripple has a Relative Strength Index of 44 for period 14. The altcoin is now declining and may do so further. The moving average lines are in between the price bars, which will cause the cryptocurrency to move in a narrow range. Above level 50 of the daily stochastic level of 50, the altcoin is in a bullish trend.
Technical Analysis
Major Resistance Levels – $2.00, $2.50, $3.00
Major Support Levels – $1.50, $1.00, $0.50
What Is the Next Direction for Ripple (XRP)?
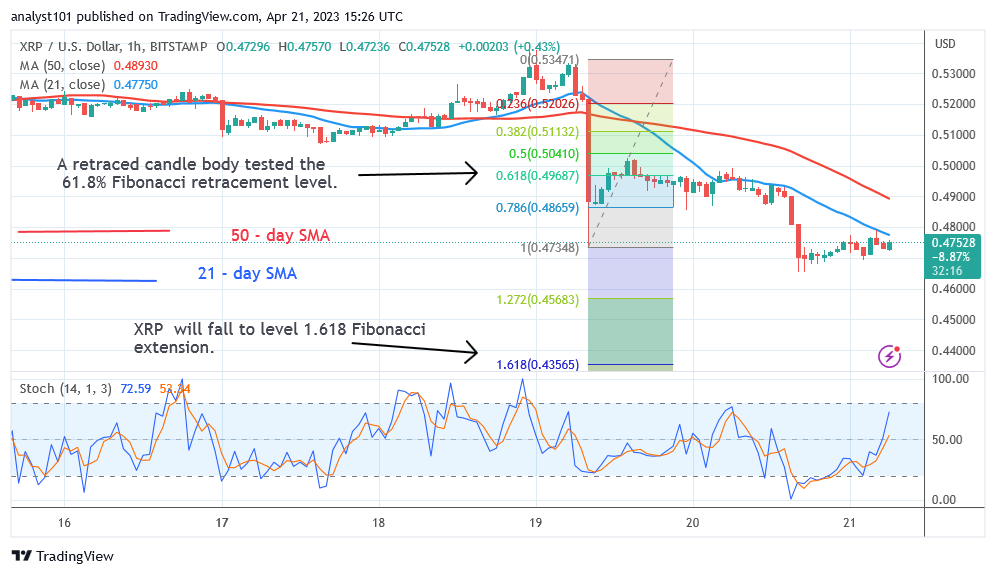
On the 1-hour chart, XRP corrects to the upside but struggles below the $0.48 high. If the price breaks above the momentum and the positive momentum is maintained, XRP will resume an uptrend. During the drop on April 19, XRP is an upward corrective, and a candle body tested the 61.8% Fibonacci retracement level. The correction predicts that XRP will go below the 1.618 Fibonacci extension’s $0.43 level.
You can purchase crypto coins here. Buy LBLOCK
Note: Cryptosignals.org is not a financial advisor. Do your research before investing your funds in any financial asset or presented product or event. We are not responsible for your investing results