Ripple Slumps, Faces Rejection At $1.20
Estimated Reading Time: 2 minutes
Don’t invest unless you’re prepared to lose all the money you invest. This is a high-risk investment and you are unlikely to be protected if something goes wrong. Take 2 minutes to learn more
Ripple (XRP) Long-Term Analysis: Bullish
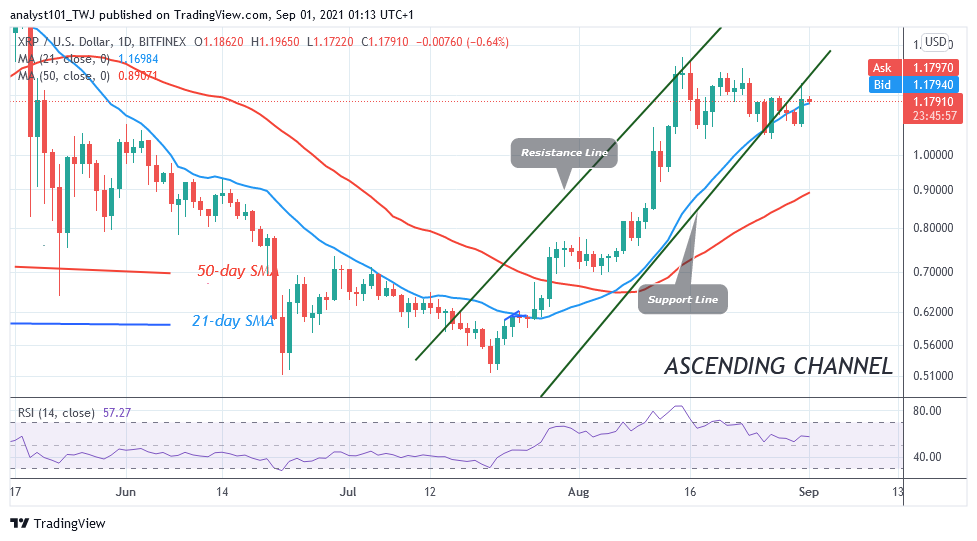
Since August 15, Ripple has been in a sideways trend. XRP price fluctuates between $1.05 and $1.30. Today, XRP is rising as it reaches a high of $1.24. The upward move has been repelled. The market has continued its range-bound move within the price range. On the downside, if price falls and retests the support at $1.05, the bulls will buy the dips. XRP price will rise to retest the upper price range. The uptrend will resume if price breaks above the $1.30 resistance. Conversely, if price breaks below the $1.05 support, XRP will decline to $0.83 low. In the meantime, XRP is trading at $1.16 at the time of writing
Ripple (XRP) Indicator Analysis
Ripple has fallen to level 56 of the Relative Strength Index period 14. It indicates that XRP is in the bullish trend zone and above the centerline 50. The altcoin is above the 25% range of the daily stochastic. It indicates that the market is in a bullish momentum. The 21-day and the 50-day SMA are sloping upward.
Technical indicators:
Major Resistance Levels – $2.00, $2.50, $3.00
Major Support Levels – $1.50, $1.00, $0.50
What Is the Next Direction for Ripple (XRP)
Ripple is retracing on the downside. The market will resume upward if price finds support above the recent low. Meanwhile, on August 41 downtrend; a retraced candle body tested the 61.8% Fibonacci retracement level. The retracement indicates that XRP will fall to level 1.618 Fibonacci or level extension or level $1.10.

You can purchase crypto coins here. Buy Tokens
Note: Cryptosignals.org is not a financial advisor. Do your research before investing your funds in any financial asset or presented product or event. We are not responsible for your investing resul