Sky (Prev. Maker) (SKY/USD) Settles at Higher Support
Estimated Reading Time: 3 minutes
Don’t invest unless you’re prepared to lose all the money you invest. This is a high-risk investment and you are unlikely to be protected if something goes wrong. Take 2 minutes to learn more
Sky (previously Maker) appears to be stabilizing above the $0.05 price level. This development follows a recent downtrend, during which the market formed a pivotal rebound around the $0.04 zone in the second half of November. Prior to this decline, SKY/USD had been gradually weakening after failing to sustain momentum above the $0.068 level.
Although the $0.05 support area initially triggered bullish interest—leading to a brief spike in volatility and rapid price fluctuations—bears eventually regained control, pushing the price below this threshold. The downward move continued until a firm support was established at $0.04, which proved strong enough to halt the decline.
The market has since recovered and is now trading back above the $0.05 level, suggesting a potential shift toward renewed stability or a possible trend reversal if buyers maintain their current momentum.
Sky (Prev. Maker) (SKY/USD) Market Data
- SKY/USD Price Now: $0.0556
- SKY/USD Market Capitalization: $1.3 billion
- SKY/USD Circulating Supply: 22.9 billion SKY
- SKY/USD Total Supply: 23.5 billion SKY
- SKYI/USD CoinMarketCap Ranking: #53
Key Levels to Watch
- Resistance: $0.06, $0.065, $0.070
- Support: $0.05, $0.045, $0.040
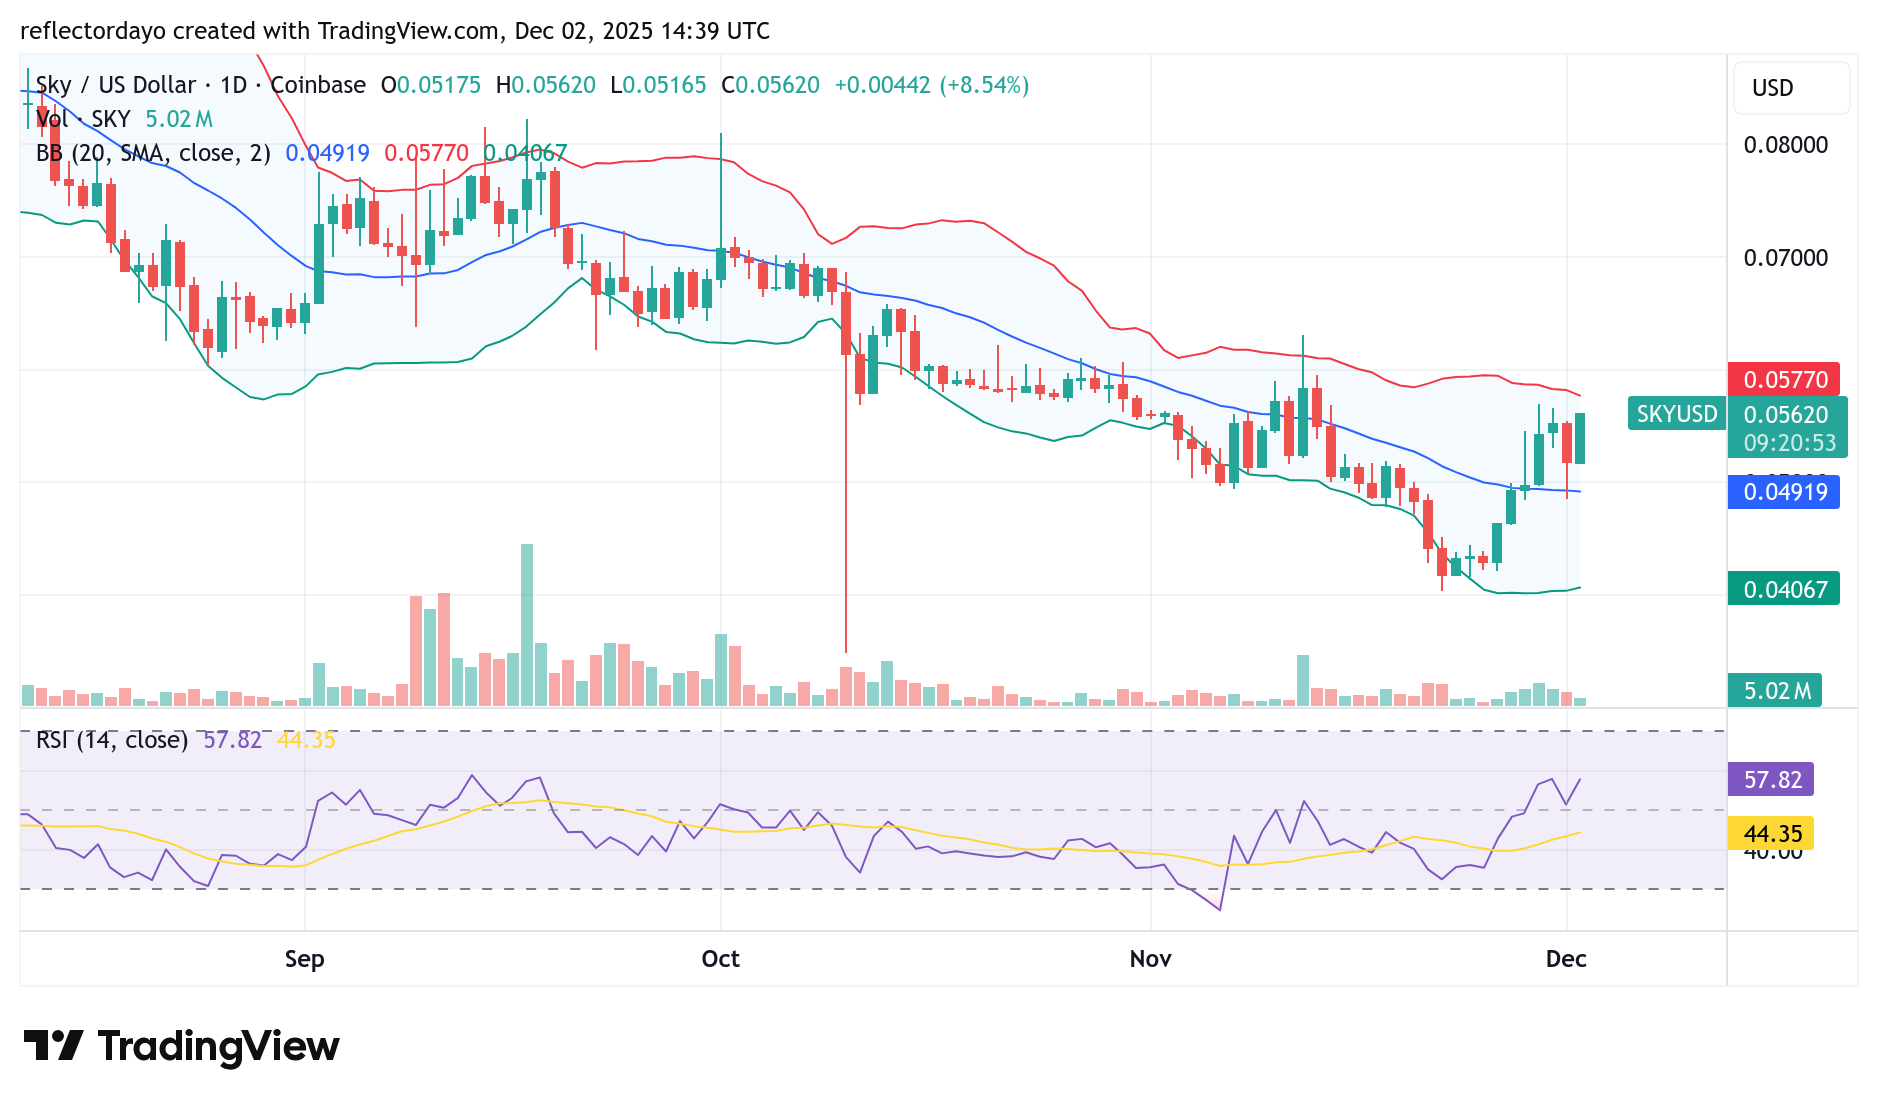
Sky (Prev. Maker) (SKY/USD) Daily Chart Analysis
With the Sky (Prev. Maker) market now holding above the key $0.05 support level, the bulls may begin shifting their focus toward challenging the $0.06 resistance zone. However, it is important to note that this area previously served as a significant battleground for demand and supply, particularly in the second half of November when the last bearish wave reached this region. As a result, traders should remain cautious, as similar price behavior may re-emerge.
Nonetheless, sustained buying interest could eventually lead to an upside breakout. Technical indicators, especially the Bollinger Bands, highlight the presence of substantial market volatility, evident from the wide bandwidth currently displayed.
For now, maintaining stability above the $0.05 level remains critical. A firm hold at this support would strengthen bullish confidence and increase the likelihood of a successful breakout in the sessions ahead.
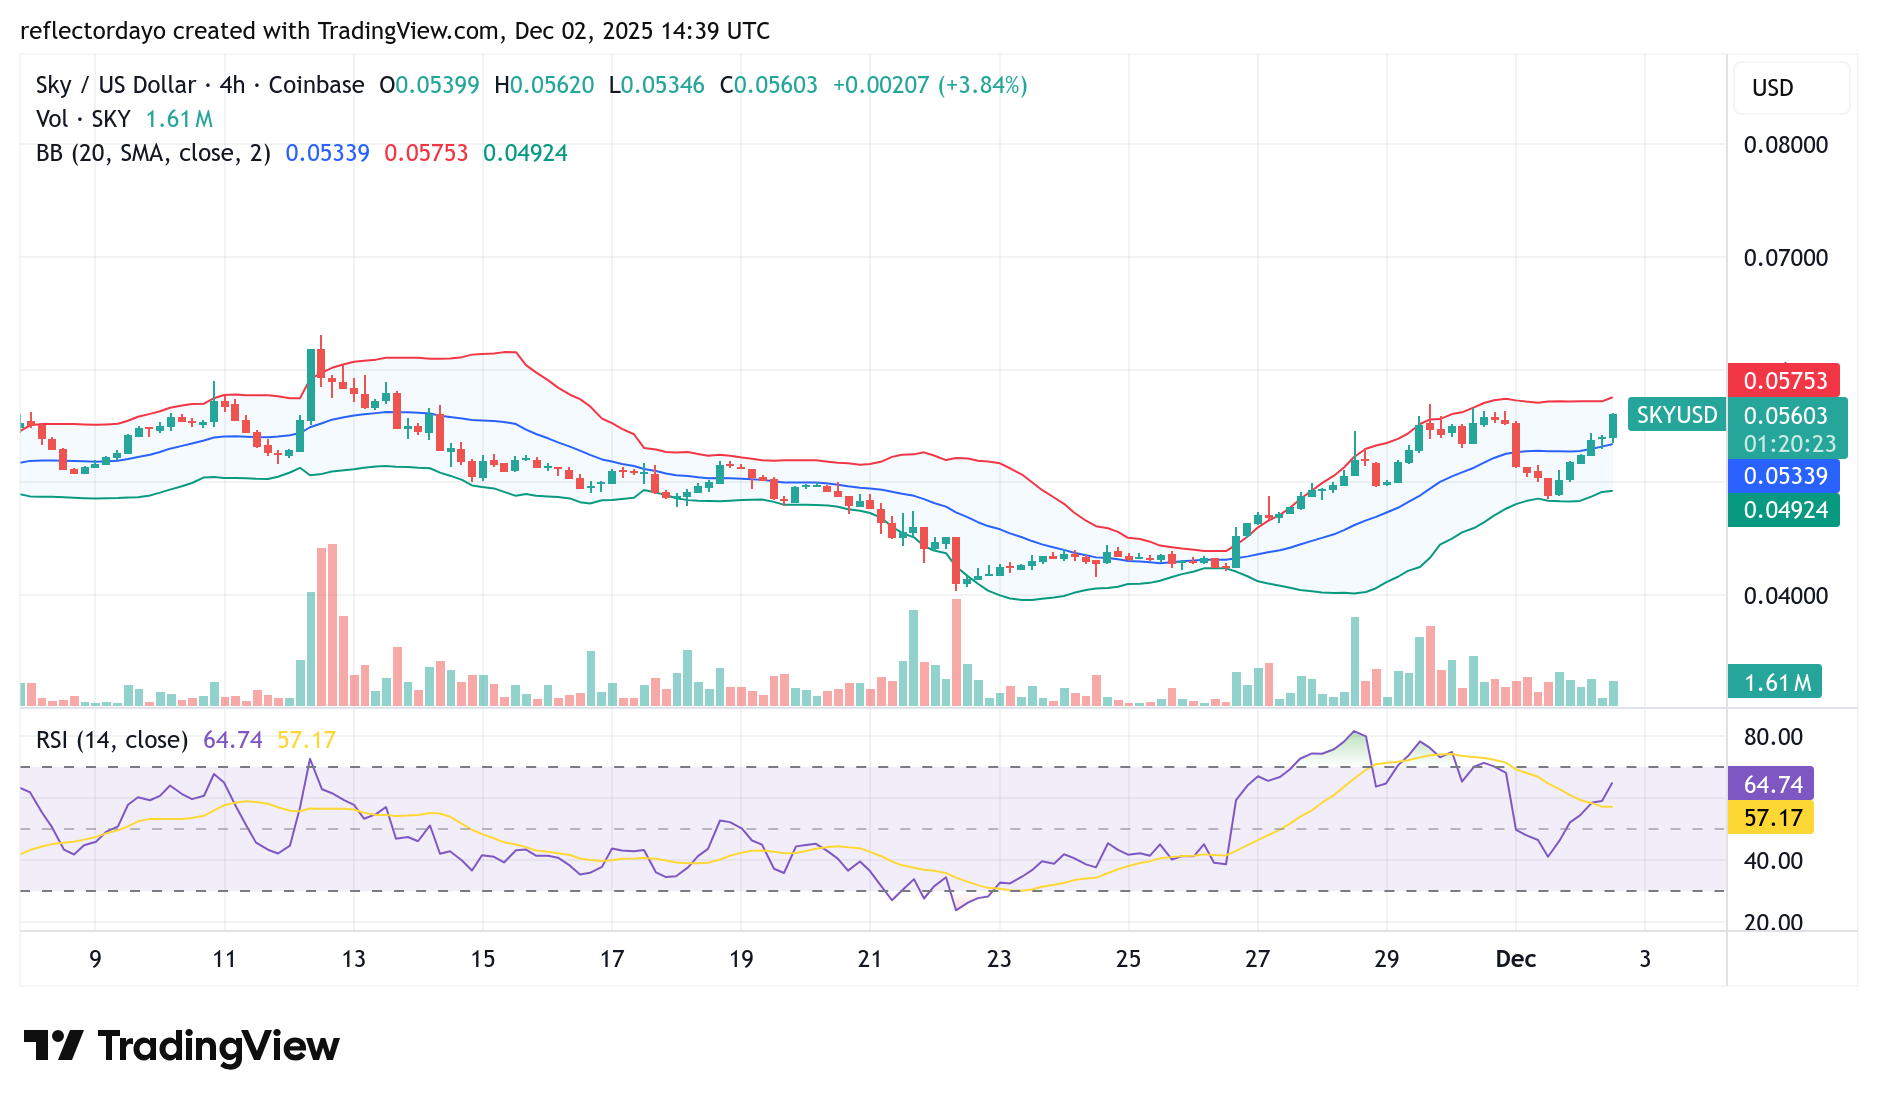
SKY/USD 4-Hour Chart Outlook
On the 4-hour timeframe, the market structure becomes clearer, revealing the momentum behind the recent bullish recovery. The Bollinger Bands indicate an emerging upward trend, supported by the bulls’ firm defense of the $0.05 level, which triggered a fresh rebound in price action.
However, resistance is becoming evident around the $0.057 zone. This development suggests that the market is currently defined by two key levels: support at $0.05 and resistance at $0.057. The interaction of demand and supply at these points reflects a tightening market structure.
Given this setup, SKY/USD may begin to consolidate within this price channel as traders wait for a decisive breakout in either direction. A strong move above $0.057 would reinforce bullish momentum, while a break below $0.05 would signal renewed bearish pressure.