Solana (SOL) Price Prediction: SOL/USDT Still Trades Above $130
Estimated Reading Time: 2 minutes
Don’t invest unless you’re prepared to lose all the money you invest. This is a high-risk investment and you are unlikely to be protected if something goes wrong. Take 2 minutes to learn more

Date: November 21, 2025
There has been tremendous bearish pressure in the general crypto market, and the Solana token hasn’t been left out. As a result, price action in this market has hit the $130 price level. However, price action hasn’t been able to breach this support level for a steeper dive.
Long-Term Trend — Bearish (Daily Chart)
Key Price Levels:
Resistance: $135, $140, $145
Support: $130, $125, $120
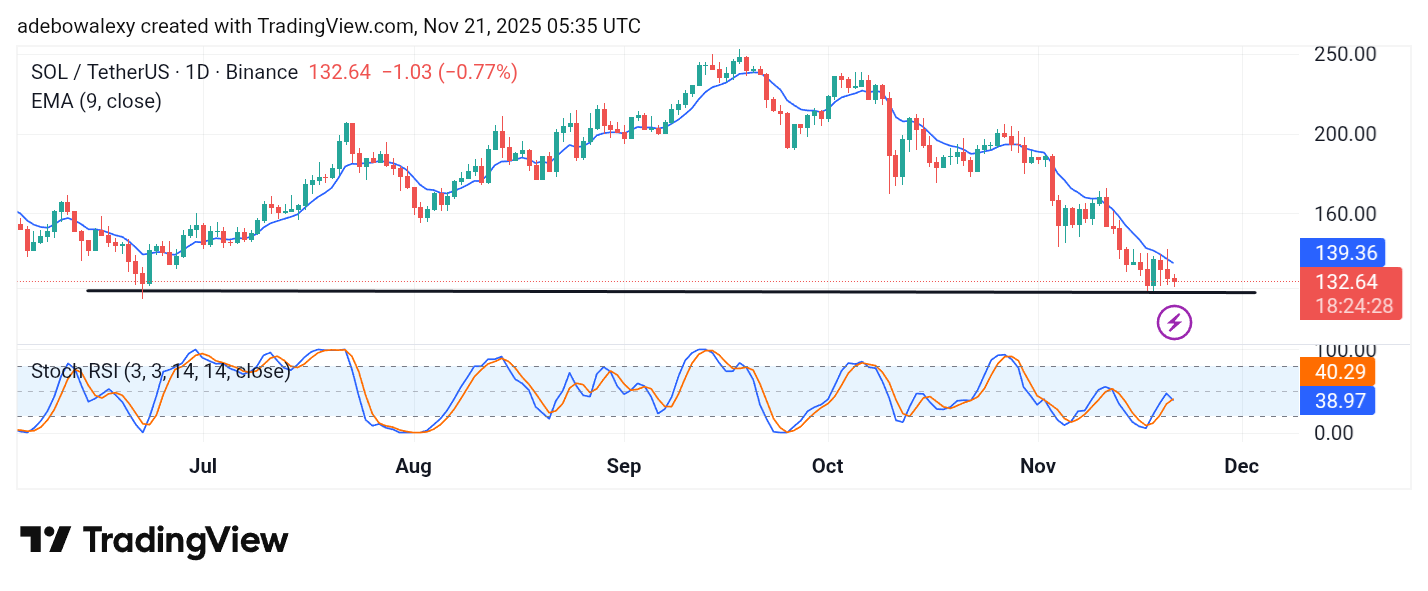
Over the week, price action in the Solana market has hit the baseline at the $130 price level. However, the market rebounded upward but remains below the 9-day Exponential Moving Average (EMA) line. The ongoing session stays in the red as the lines of the Stochastic Relative Strength Index (SRSI) indicator are at a convergence for a bearish crossover.
Solana (SOL) Price Prediction: SOL/USDT Market Keeps Spiraling Downward
Going by the movement of price activity in the market, it appears that price activity is still under bearish momentum. The last price candle stays red and below the 9-day EMA curve.
The ongoing session has formed a downward rebound in Solana over the past two sessions. The convergence of the SRSI indicator lines suggests that the bearish movement may extend through the $130 price level. Therefore, traders can stay bearish on this market.
Solana (SOL) Price Prediction: SOL/USDT Is Set to Fall Lower (4-Hour Chart)
The Solana market has kept to its bearish trajectory. On the token’s 4-hour chart, it can be seen that price action has stayed red for the past five sessions. This session is still bearish and has appeared below the 9-day EMA line.
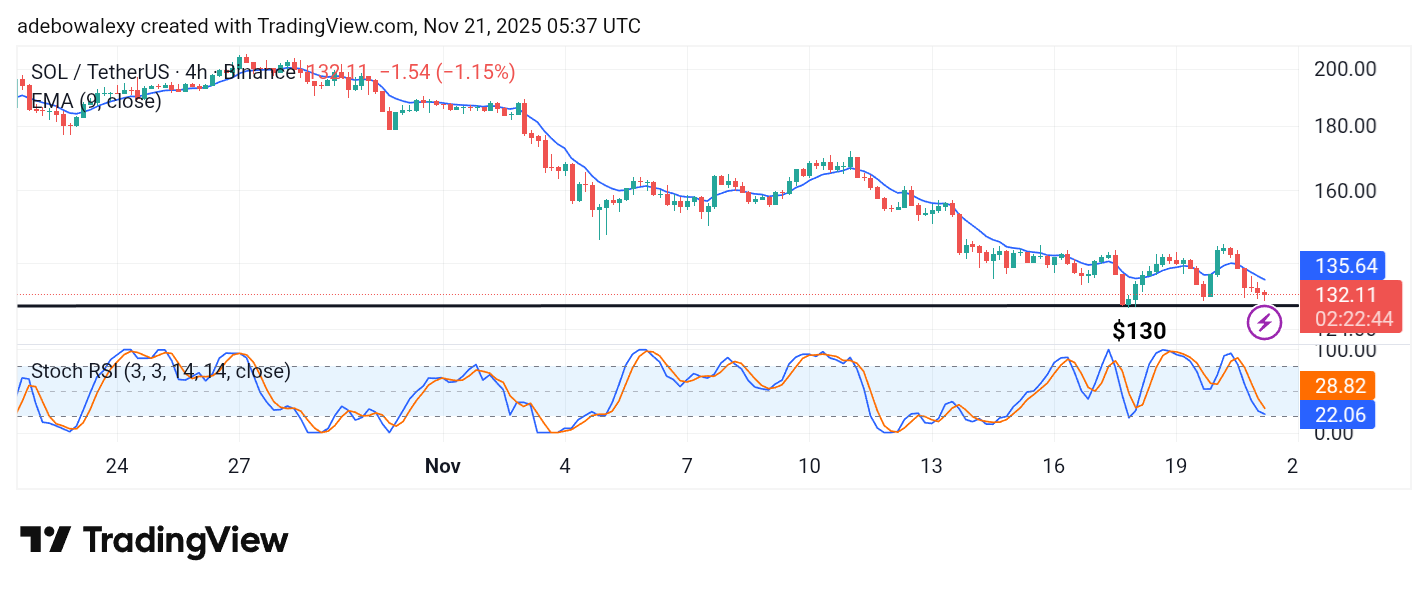
However, the last three sessions on this chart appear low on bearish momentum considering the size of the corresponding price candles. The lines of the SRSI indicator can be seen descending into the oversold region, but the terminal end of the indicator is slightly curved, suggesting stiffness in bearish progress.
At this point, it appears the market may bounce off the $130 price level once more.Therefore, traders may continue to keep their bearish targets around the $135 price level.