Solana (SOL/USD) Bulls Conquer New Territories
Estimated Reading Time: 2 minutes
Don’t invest unless you’re prepared to lose all the money you invest. This is a high-risk investment and you are unlikely to be protected if something goes wrong. Take 2 minutes to learn more
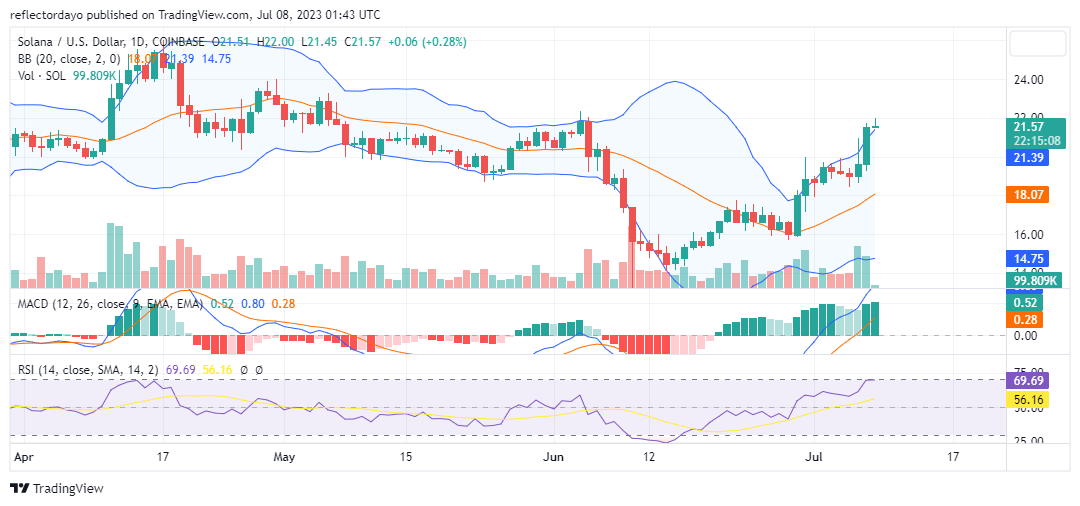
In the Solana market, a notable observation is the series of higher lows since the beginning of July. On July 1, the market initiated an upward movement from the $18.29 support level. After reaching the $20 price level, a retracement occurred, finding a higher baseline at the $19.42 price level. This new support level has facilitated the bullish conquest of the $20 price zone.
Solana Market Data
- SOL/USD Price Now: $21.64
- SOL/USD Market Cap: $8,778,559,718
- SOL/USD Circulating Supply: 401,514,671 SOL
- SOL/USD Total Supply: 551,905,263
- SOL/USD CoinMarketCap Ranking: #9
Key Levels
- Resistance: $22.00, $22.50, and $23.00
- Support: $19.00, $18.50, and $18.00.
Price Prediction for Solana: The Indicators’ Point of View
Examining the Bollinger Bands, we observe a divergence as the bull market drives prices higher. The upper standard deviation curve moves upward in line with the strong Solana bull market, indicating potential upward momentum. Conversely, the lower standard deviation curve moves downward, representing a widening price range and increased market volatility.
In terms of momentum, the Relative Strength Index (RSI) currently measures around 66.21. This indicates that the market has moderate momentum, reflecting the presence of buying pressure in the current bullish phase.
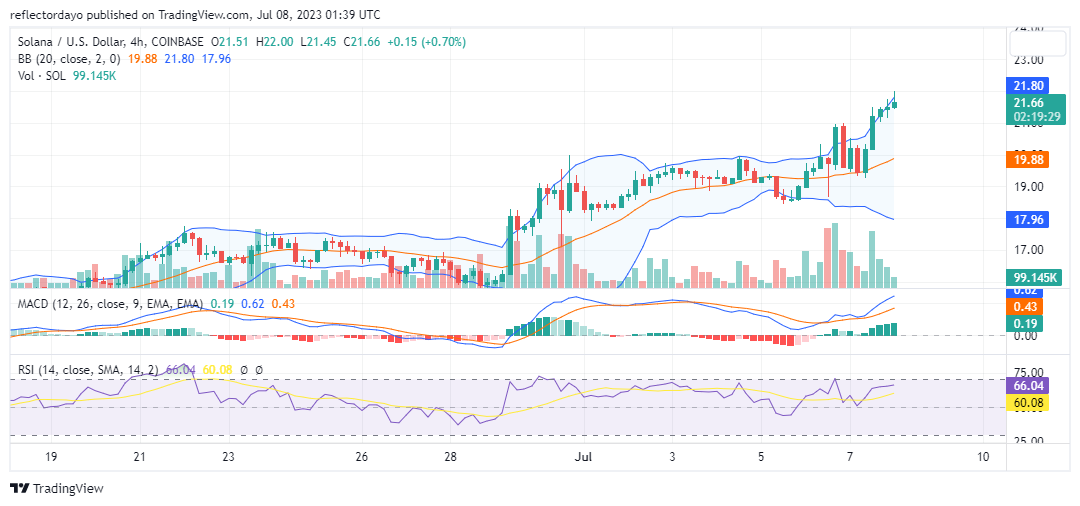
SOL/USD 4-Hour Chart Outlook
Looking at the market from this point of view, the market sentiment for Solana still appears very positive. The series of higher lows, along with the break above the $20 resistance level and the divergence in the Bollinger Bands, suggest a potential continuation of the bullish trend.