$SPONGE (SPONGE/USD) Bulls Finally Reclaims $0.0004
Estimated Reading Time: 3 minutes
Don’t invest unless you’re prepared to lose all the money you invest. This is a high-risk investment and you are unlikely to be protected if something goes wrong. Take 2 minutes to learn more
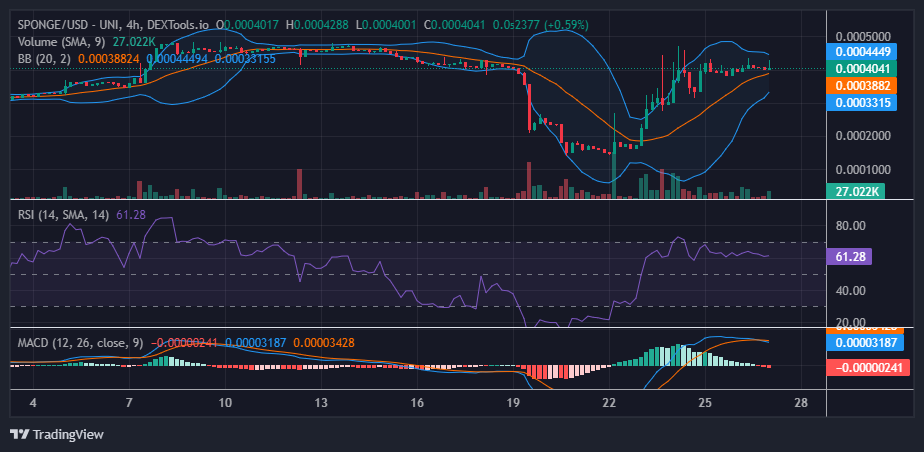
Between yesterday’s trading session and today’s, the $SPONGE market experienced minor fluctuations, briefly surpassing the key $0.0004 price level. However, the market has since stabilized, facing significant bearish sentiment around this threshold. Notably in the $SPONGE market, the pronounced upper shadows on two recent candlesticks indicate temporary bullish activity, albeit not yet sustainable.
Key Price Levels:
- Resistance: $0.00047, $0.00050, and $0.00060.
- Support: $0.000350, $0.00030, and $0.00025.
Technical Analysis for $SPONGE (SPONGE/USD):
The $SPONGE bulls have successfully pushed the price above the $0.0004 level, which had previously succumbed to bearish pressure during the recent downturn. Earlier analyses indicated the price was hovering just below $0.0004, but it has now surpassed this mark. The Bollinger Bands indicator suggests a period of market indecision, hinting at an imminent directional shift. Concurrently, the Relative Strength Index registers at 61.26, signaling favorable momentum for bulls and potentially supporting further upward price movement.
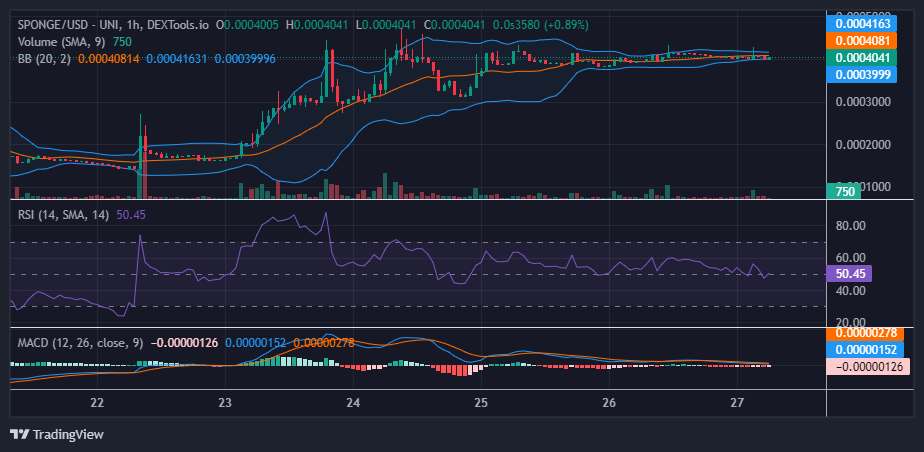
Short-Term Projection on the 1-Hour Chart:
Despite the market’s consolidation, as evidenced by the Bollinger Bands indicator, the bulls appear to maintain a marginal advantage over the bears, attributable to a slightly higher low. The narrowing of the bands suggests an impending price breakout, likely in a bullish direction.
A significant observation from the Bollinger Bands is the narrowing of the bands themselves. When the bands contract or narrow down, it often suggests that volatility is decreasing after a period of heightened price fluctuation. This contraction can act as a precursor or warning sign to an impending price breakout. Given the current state of the bands, which are narrowing, there is a growing anticipation in the market that a breakout is on the horizon. Furthermore, the direction of this anticipated breakout seems to lean towards the bullish side, given the marginal advantage held by the bulls.
Is your wallet empty of $SPONGE? Don’t miss out; purchase $SPONGE with our website’s main page widget.
No $SPONGE in your wallet? Don’t miss out, buy $SPONGE via the home page widget on our website. 💪
Purchased tokens will automatically be staked in our V2 smart contract to secure a share of the V2 token once it launches
Time to absorb more damp!🧽💦#SpongeV2 #MemeCoin #Alts pic.twitter.com/Z1UuSOAfIE
— $SPONGE (@spongeoneth) December 27, 2023
Invest in the hottest and best meme coin. Buy Sponge ($SPONGE) today!