$SPONGE (SPONGE/USD) Bulls Trying to Claim a $0.0003 Price Level for a Higher Support Level
Estimated Reading Time: 2 minutes
Don’t invest unless you’re prepared to lose all the money you invest. This is a high-risk investment and you are unlikely to be protected if something goes wrong. Take 2 minutes to learn more
Examining the bearish pressure evident in the preceding $SPONGE market analysis, it was anticipated that $0.00025 would serve as the final line of defense for bullish sentiments. However, a notable resurgence of bullish momentum occurred at the $0.000275 price level, successfully reversing the market trajectory. The bullish trend persisted, propelling prices to the $0.0003 level. Subsequently, a bearish market correction ensued around $0.000337; nevertheless, bullish forces are currently maintaining a strong foothold at the $0.0003 price level.
Key Price Levels
- Resistance: $0.00035, $0.00040, and $0.00045.
- Support: $0.000250, $0.00020, and $0.00019.
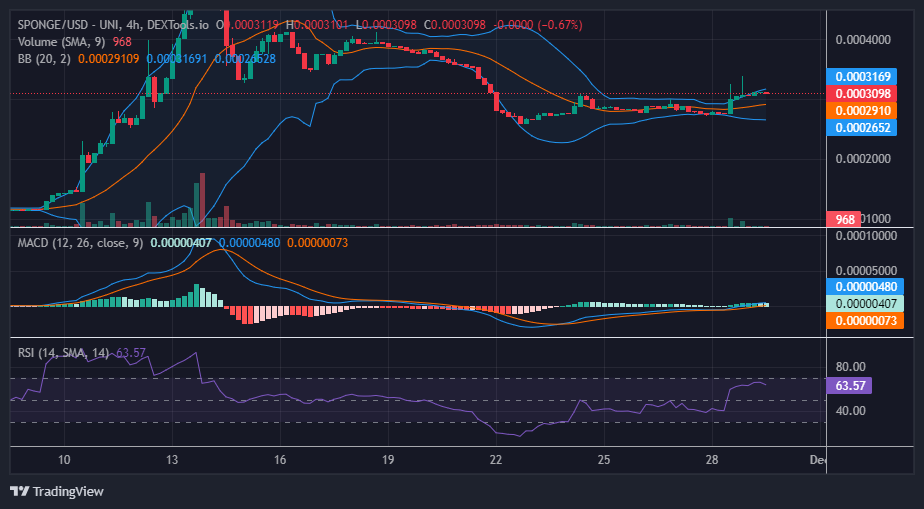
Technical Insights for $SPONGE (SPONGE/USD) Price Analysis:
The presence of a prolonged upper shadow indicates bearish pressure above the $0.0003 price threshold. However, $SPONGE bulls are effectively countering the bears in the vicinity of $0.0003, elucidating the recent emergence of a four-price doji on the chart. According to the Bollinger Bands indicator, both the upper standard deviation curve and the 20-day moving average are currently ascending in response to the positive developments in the market. The lower standard deviation is beginning to reflect the upward momentum as well. Although the upper shadow poses a bearish threat to the market, the consolidation of the price at the $0.0003 level may fortify it as a support level.
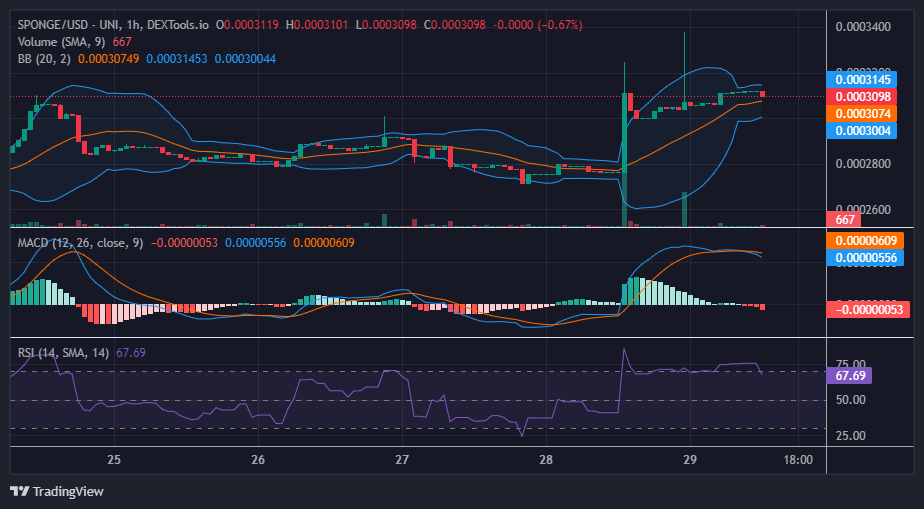
Short-Term Outlook on the 1-Hour Chart:
Analyzing the 1-hour chart, the Bollinger Bands indicator depicts an upward-trending price channel. While the hourly candles predominantly resemble dojis, there is a discernible shift towards an upward trajectory in the market. However, $SPONGE traders should take note of the overbought signal indicated by the Relative Strength Index. In response, $0.0003 may evolve into a new, higher support level, potentially serving as a pivot for further bullish price performance.
Buy the Sponge Token!
GM frens 🧽💛#SPONGE #Crypto #Web3 #Alts pic.twitter.com/9MBOeRv1HV
— $SPONGE (@spongeoneth) November 8, 2023
Invest in the hottest and best meme coin. Buy Sponge ($SPONGE) today!