$Sponge (SPONGE/USD) Claims a New Baseline for an Upside Action
Estimated Reading Time: 2 minutes
Don’t invest unless you’re prepared to lose all the money you invest. This is a high-risk investment and you are unlikely to be protected if something goes wrong. Take 2 minutes to learn more

SPONGE/USD‘s performance in the previous daily market session launched it above the $0.0005 price level. After having to deal with bears among traders around the $0.0005 price level in the previous daily session, the market saw a retracement. The retracement then settled the market at a higher support level of $0.000454. Being in proximity to the key resistance level, this new support level should form the baseline for further advancement into the supply zone.
Key Levels
- Resistance: $0.0007855, $0.0010, and $0.00117
- Support: $0.00040, $0.00035, and $0.00032
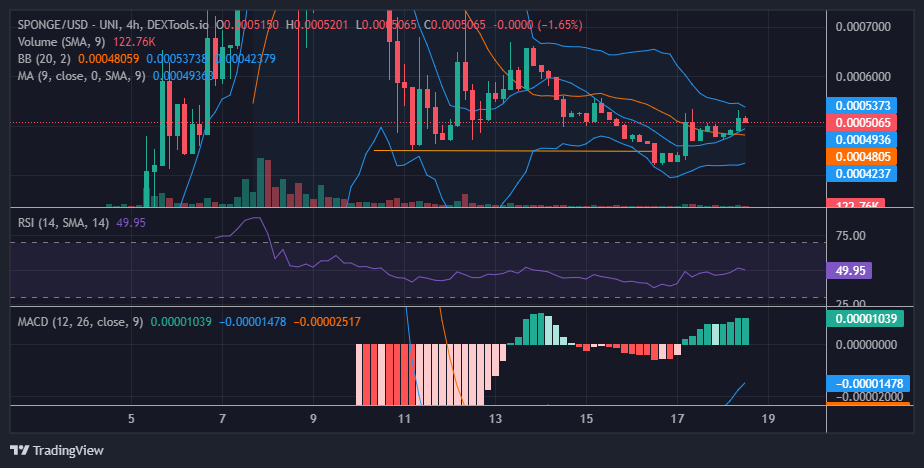
Sponge (SPONGE/USD) Price Analysis: The Indicators’ Point of View
Today’s market re-attempted the $0.0005 price level but had to face the same resistance it faced in the previous daily session. For the bullish move to be established as a trend, the price action must break the resistance at $0.00053. The increased volatility can make this possible. According to the Moving Average Convergence and Divergence (MACD) indicator, the bull market gains vigor for more upside action and the repeated attempt to break the resistance might eventually force the supply level to give way.
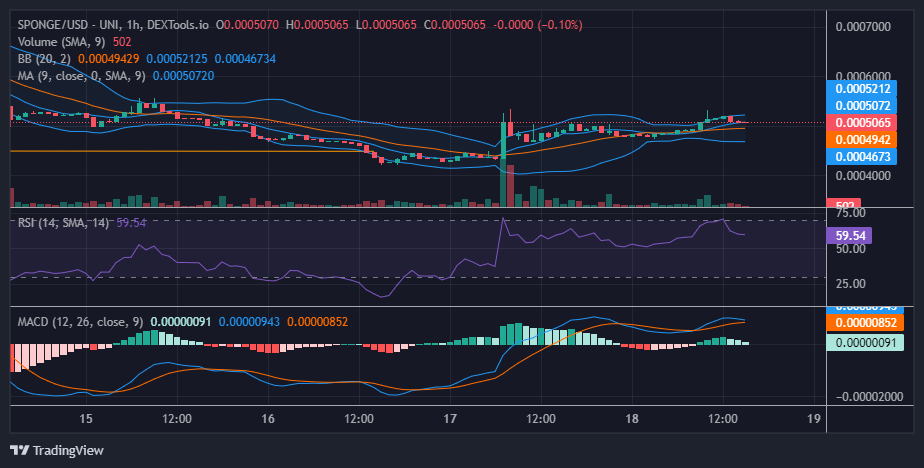
Sponge Short-Term Outlook: 1-Hour Chart
In the 1-hour timeframe, the narrow price channel illustrated by the Bollinger Bands indicator testifies to the intense struggle at the key resistance level. But even in a smaller timeframe, bulls are making impressive advances toward sustaining a trend. A new support level may likely form above the 20-day moving average. This will be a vantage point for more bullish encroachment on the supply level.
Check out SpongeBob on tick tock.
#SPONGERS, check out $SPONGE's new TikTok! 🧽💃🕺https://t.co/gIY5jS4133
Tune in and Absorb the Damp💦🧽 pic.twitter.com/vIAeJDoeNE
— $SPONGE (@spongeoneth) May 18, 2023
Invest in the hottest and best meme coin. Buy SpongeBob ($SPONGE) today!