$SPONGE (SPONGE/USD) Coiling for Impact: Technicals Align for Potential Bullish Breakout
Estimated Reading Time: 2 minutes
Don’t invest unless you’re prepared to lose all the money you invest. This is a high-risk investment and you are unlikely to be protected if something goes wrong. Take 2 minutes to learn more

The $SPONGE market is showing classic signs of a price compression, with the token consolidating tightly around the $0.00009 level. This quiet period is likely the prelude to a significant move, as key daily chart indicators are stacking up in favor of the bulls.
This current consolidation is an accumulation phase in disguise, where shrewd investors are building their positions. If bullish momentum asserts itself, we could see a powerful upward breakout from this narrow range.
Crucial Levels to Monitor:
- Resistance: $0.000115, $0.000120, $0.000130
- Support: $0.000090, $0.000085, $0.000080
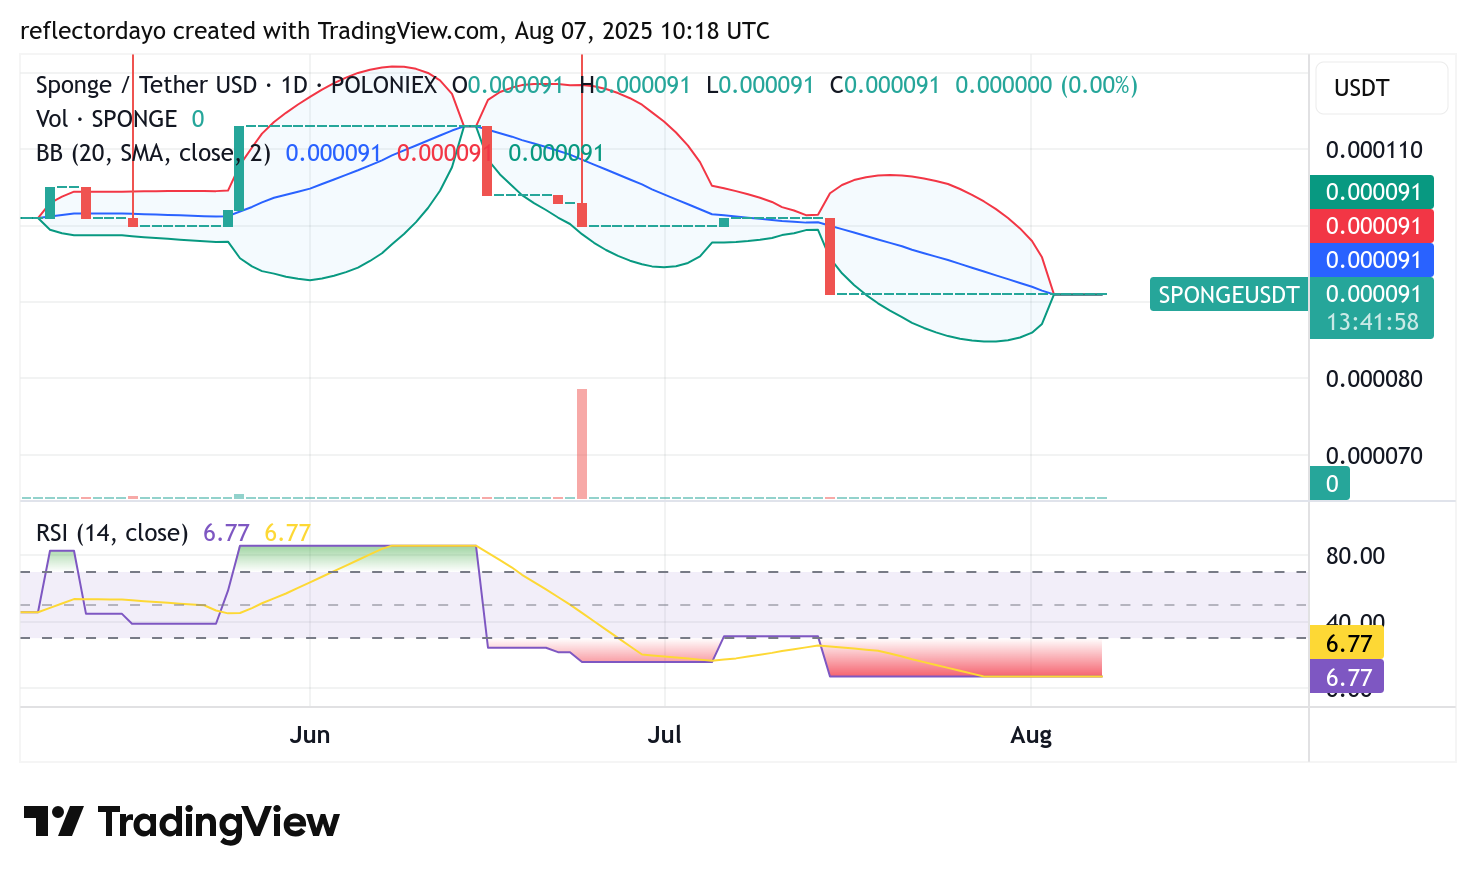
$SPONGE Daily Chart: A Ticking Clock of Volatility
On the $SPONGE daily chart, the Bollinger Bands have converged dramatically, a pattern known as a “volatility squeeze.” This technical formation signals that a period of low volatility is about to give way to a period of high volatility and a major directional move. Price action is currently pinned around the $0.000091 mark, right on the cusp of a key support zone.
Furthermore, the Relative Strength Index (RSI) remains in oversold territory, suggesting that sellers may have exhausted their efforts. The confluence of these two powerful crypto signals—a volatility squeeze and an oversold RSI—creates a high-probability setup for a decisive move, which technicals suggest is more likely to be to the upside.
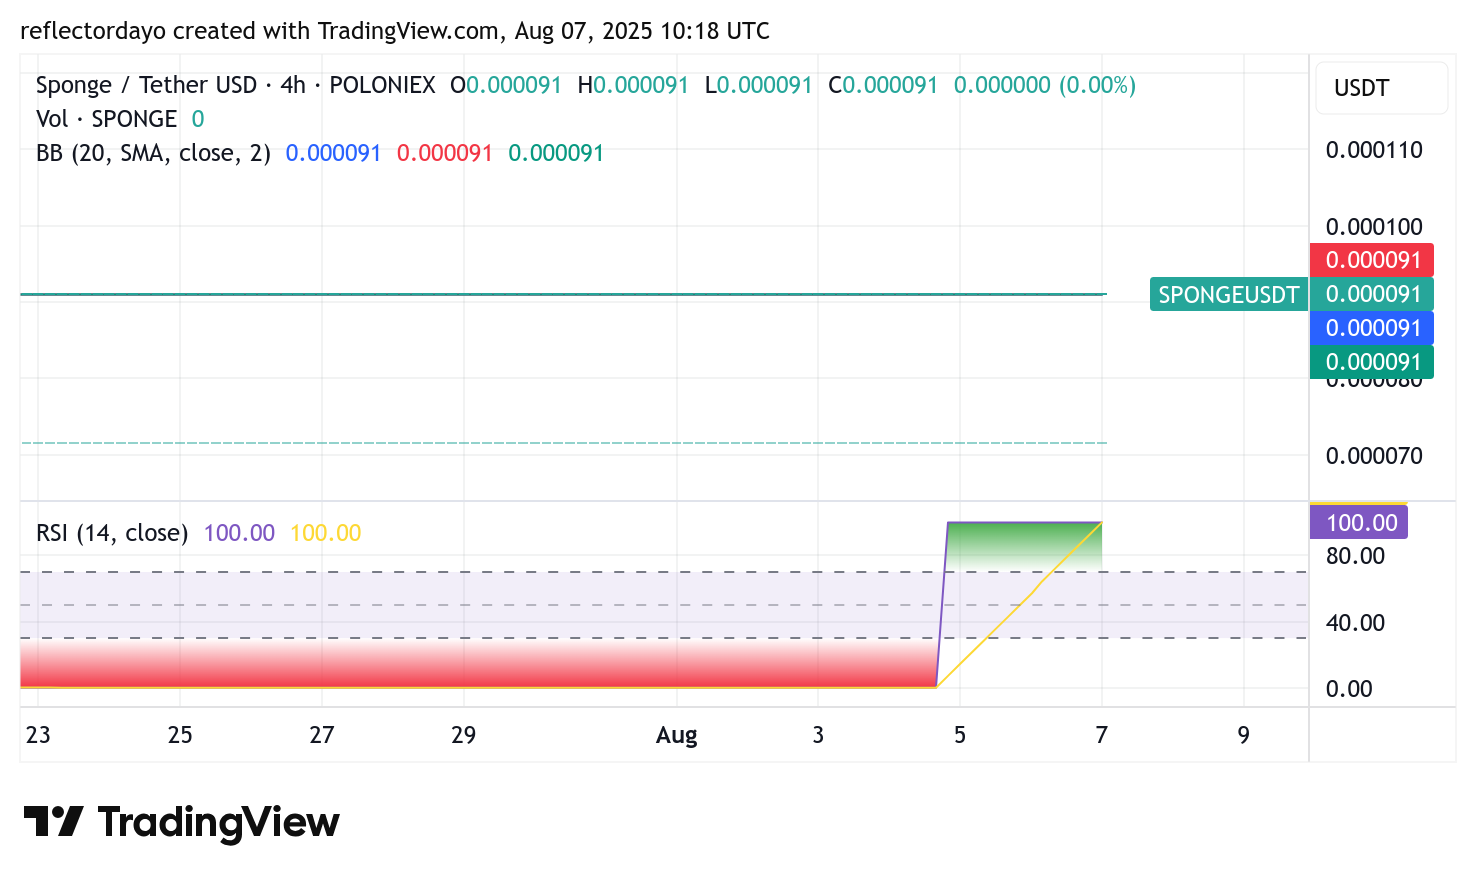
SPONGE/USD 4-Hour Chart: The Foundation of a Breakout
The 4-hour chart provides a closer look at the strength of the $0.00009 support. Repeated attempts by sellers to push below this level have been met with stubborn buying pressure, leading to a tight, sideways trading range. This persistent defense of support is a strong indication of an accumulation phase, where demand is quietly absorbing supply. This firm foundation could easily become the springboard for a fresh rally once momentum shifts back in favor of the bulls.
Buy SPONGE/USD!
Waiting for meme season to hit like pic.twitter.com/9ZPhYzk60I
— $SPONGE (@spongeoneth) August 6, 2025
Join the SPONGE community and get in on the next big crypto opportunity! Buy Sponge ($SPONGE) today