$SPONGE (SPONGE/USD) Poised for a Rebound Above the $0.0002 Threshold
Estimated Reading Time: 2 minutes
Don’t invest unless you’re prepared to lose all the money you invest. This is a high-risk investment and you are unlikely to be protected if something goes wrong. Take 2 minutes to learn more
On December 19, the SPONGE/USD market experienced a pronounced bearish downturn, resulting in a notable decline towards the $0.0002 price level. This marked a substantial move by the bearish segment of the market. Despite attempts by the bulls to defend the $0.0002 price level and counter the aggressive selling pressure, their efforts proved insufficient, leading them to regroup below this pivotal price point.
Key Price Levels:
- Resistance: $0.00047, $0.00050, and $0.00060.
- Support: $0.000350, $0.00030, and $0.00025.
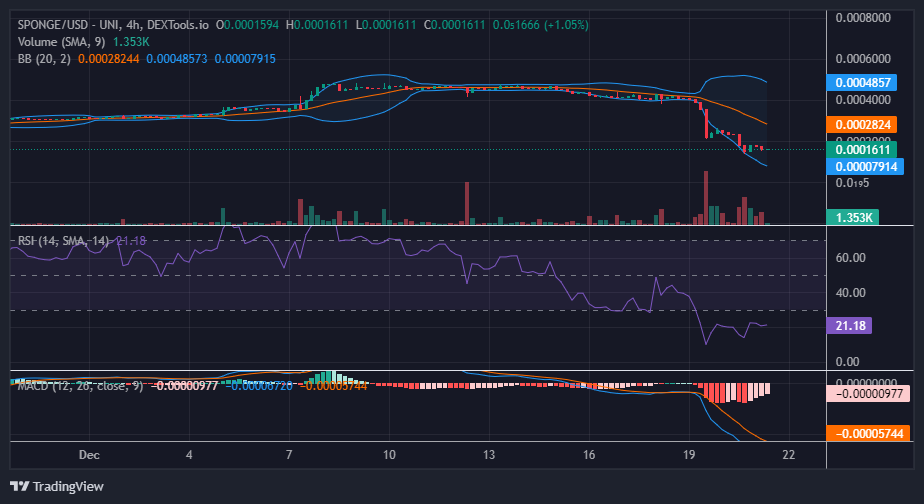
Technical Analysis for $SPONGE (SPONGE/USD):
The persistent bearish momentum has been temporarily halted by substantial bullish traders, and the market’s movement seems pegged around the $0.00016 mark. It is anticipated that the SPONGE/USD price may rebound from this level. Investors have a compelling reason to anticipate a notable bullish recovery from this point. Examination of the Relative Strength Index (RSI) reveals that it has hovered around the 20 level. Such a reading suggests that the market is significantly oversold, with assets potentially being sold below their intrinsic value. Given this context and the bullish sentiment around the $0.0002 level, a bullish recovery is anticipated at this juncture.
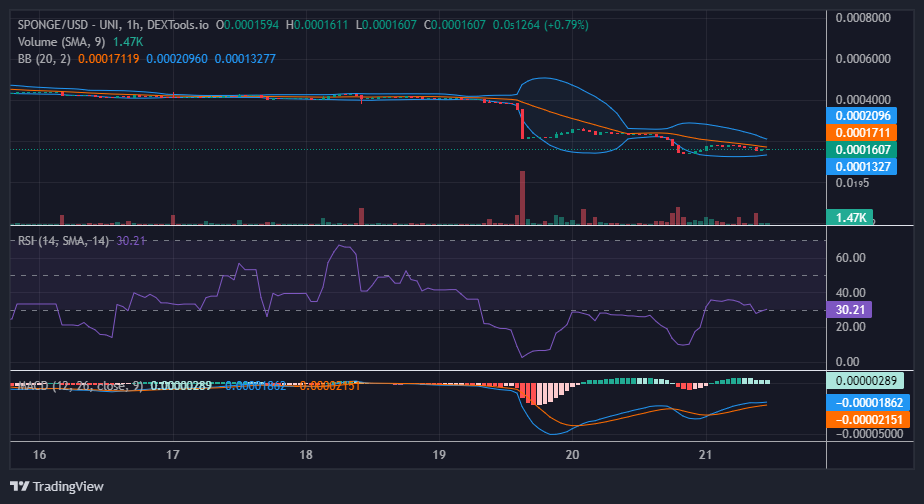
Short-Term Projection on the 1-Hour Chart:
On the 1-hour chart, there is notable bullish resistance evident against the bearish momentum, particularly around the $0.00016 price level, which has led to the formation of a horizontal pattern characterized by flat candlesticks. Current indicators suggest a potential bullish recovery. Within the Relative Strength Index (RSI), the RSI line has retraced to the 30 level, indicating potential further room for bullish recovery in the SPONGE/USD market.
Buy SPONGE/USD!
Welcome to $SPONGE 🔥🚀🧽#SPONGE #BullMarket #AltSeason pic.twitter.com/ewWpsImPaA
— $SPONGE (@spongeoneth) December 21, 2023
Invest in the hottest and best meme coin. Buy Sponge ($SPONGE) today!