SPONGE/USD in a Tight Coil: A Spring-Loaded Setup Nears Its Trigger
Estimated Reading Time: 2 minutes
Don’t invest unless you’re prepared to lose all the money you invest. This is a high-risk investment and you are unlikely to be protected if something goes wrong. Take 2 minutes to learn more

The SPONGE/USD chart has transitioned from a steep decline to a state of compressed equilibrium. The market is no longer in freefall but is instead coiling tightly at the $0.000013 foundation. This is a classic energy-accumulation pattern, where the previous selling frenzy has been fully absorbed, and a new directional impulse is being prepared.
Key Price Levels
- Resistance: $0.000115, $0.000120, $0.000130
- Support: $0.000010, $0.000009, $0.000008
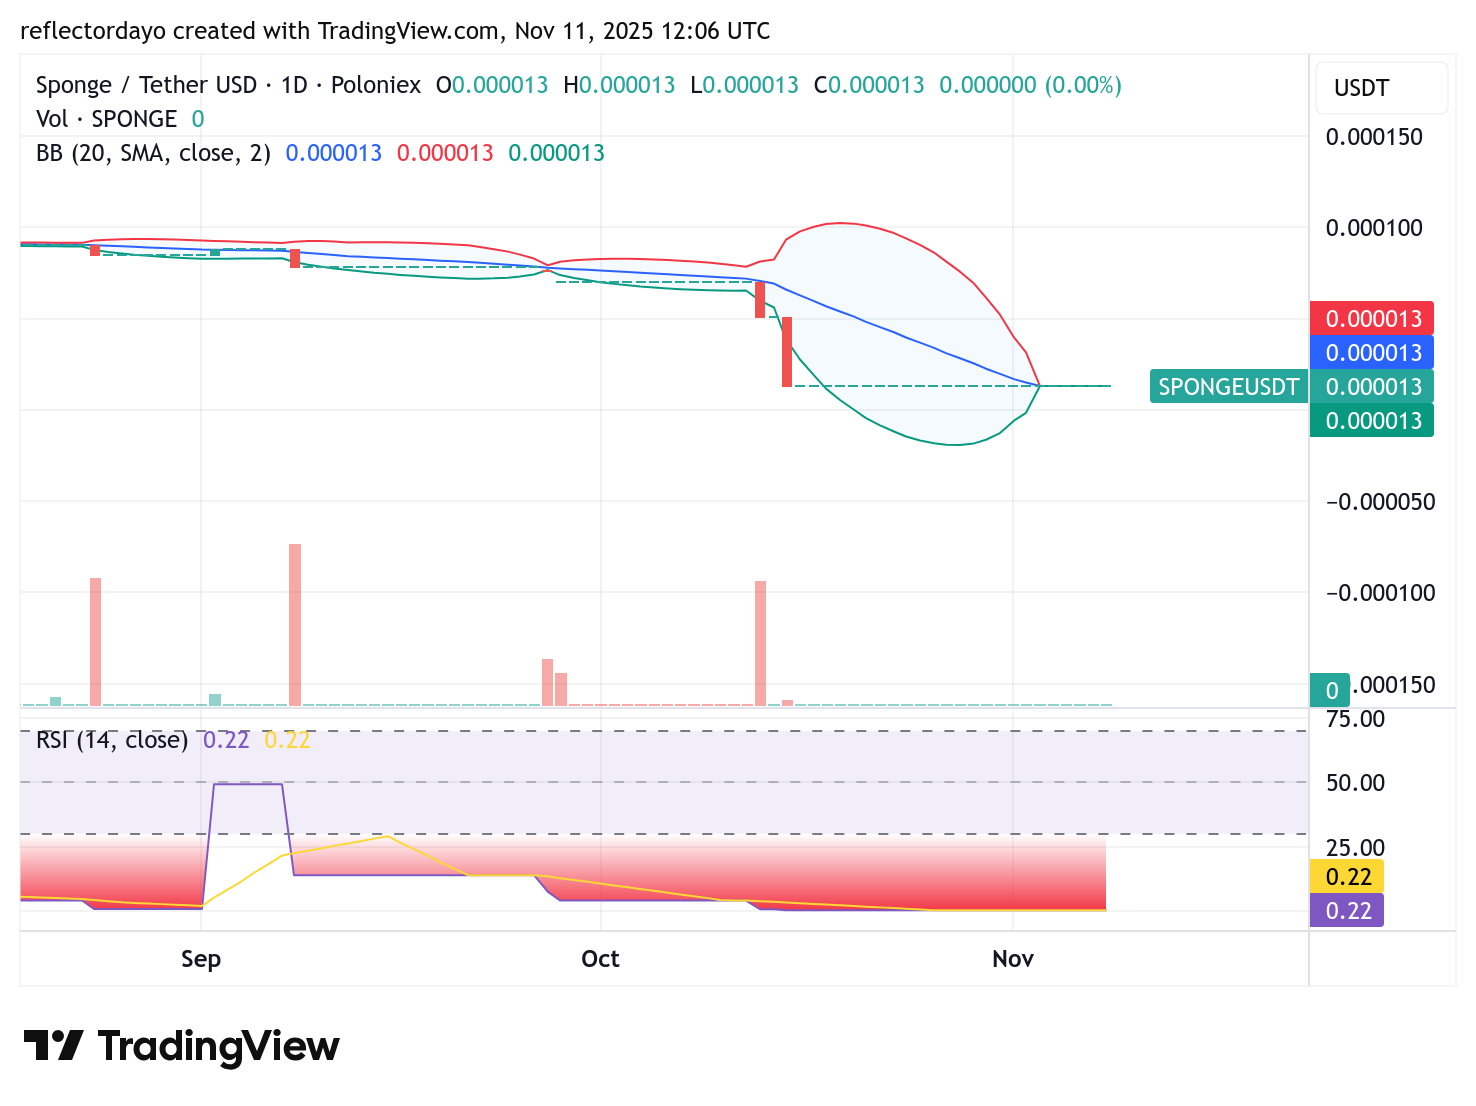
SPONGE/USD Daily Chart
The technical indicators are aligned for a potential release. On the daily chart, the SPONGE/USD price is hovering at a Bollinger Band extreme while the RSI remains buried in oversold territory. This divergence between static price action and extreme momentum readings is a powerful, if silent, signal that the bears have overstayed their welcome. The conditions in the crypto signal are ripe for a sharp mean-reversion bounce.

$SPONGE 4-Hour Chart
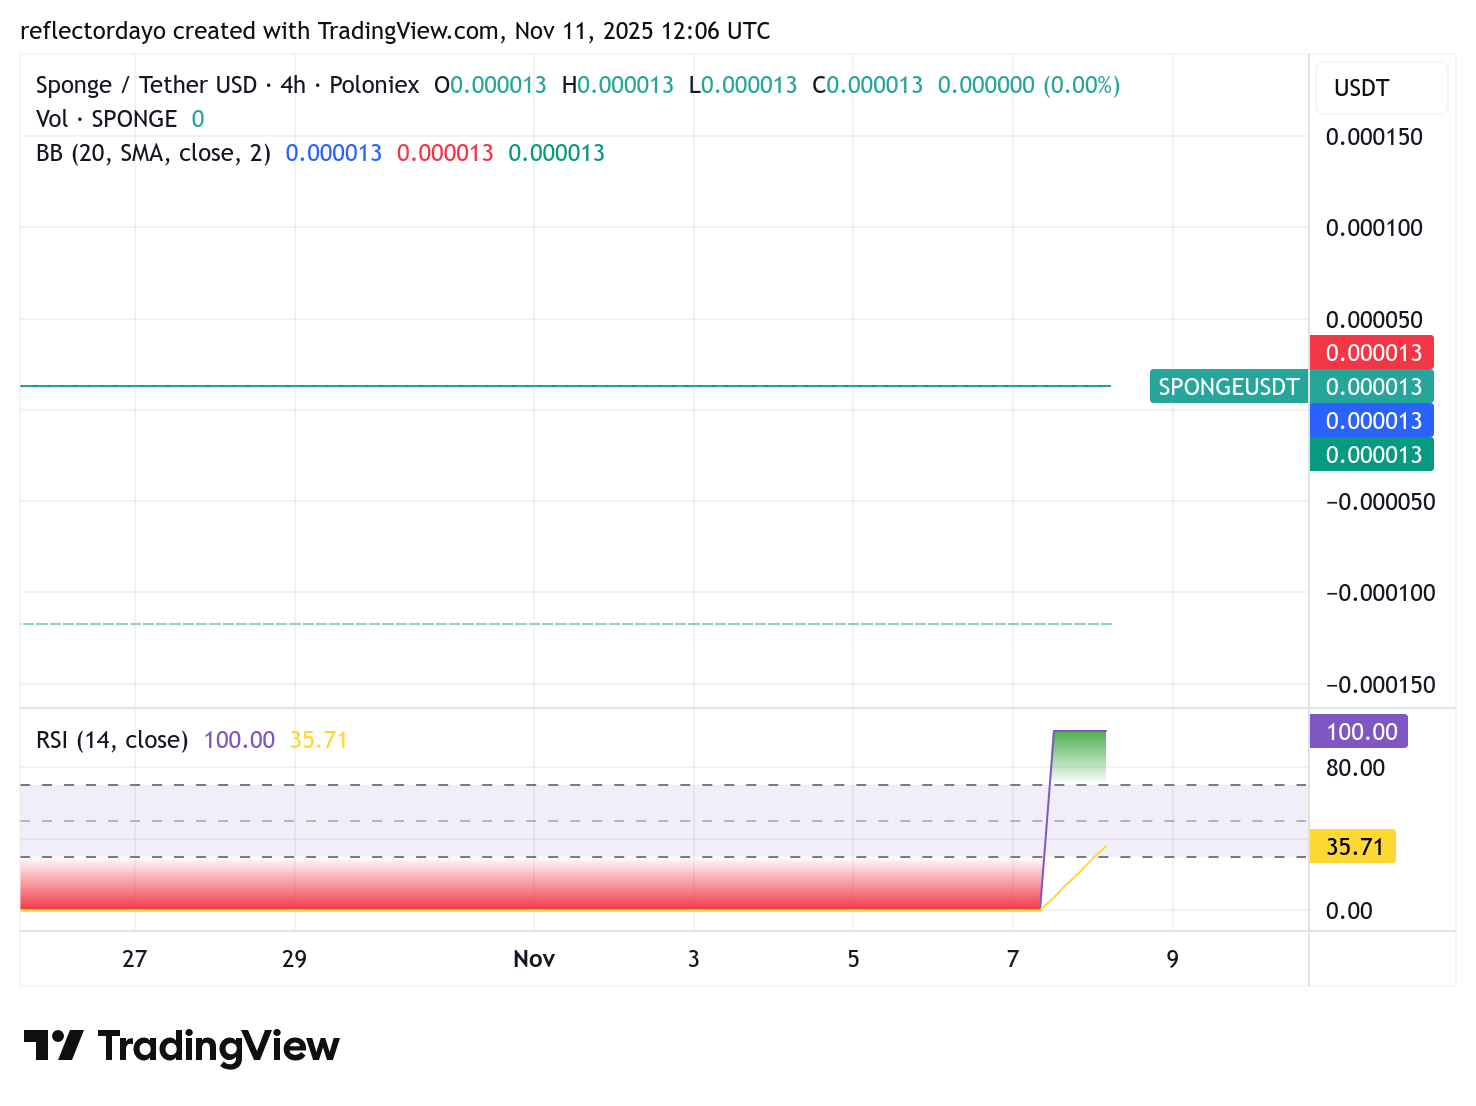
The 4-hour chart is where the tension is most palpable. The narrowing SPONGE/USD price range and declining volume are the hallmarks of a market building potential energy. This coiled spring cannot remain compressed forever. A decisive break above the local consolidation high is likely to unleash a powerful thrust, with an initial target zone around $0.00006. For strategic traders, this is a period of high-alert patience, waiting for the market to show its hand.
Buy $SPONGE!
When it pumps right after you sell pic.twitter.com/qy7xKuCLU0
— $SPONGE (@spongeoneth) November 10, 2025
Join the SPONGE community and get in on the next big crypto opportunity! Buy Sponge ($SPONGE) today