SPONGE/USD ($SPONGE) Market Enters the Demand Zone
Estimated Reading Time: 2 minutes
Don’t invest unless you’re prepared to lose all the money you invest. This is a high-risk investment and you are unlikely to be protected if something goes wrong. Take 2 minutes to learn more
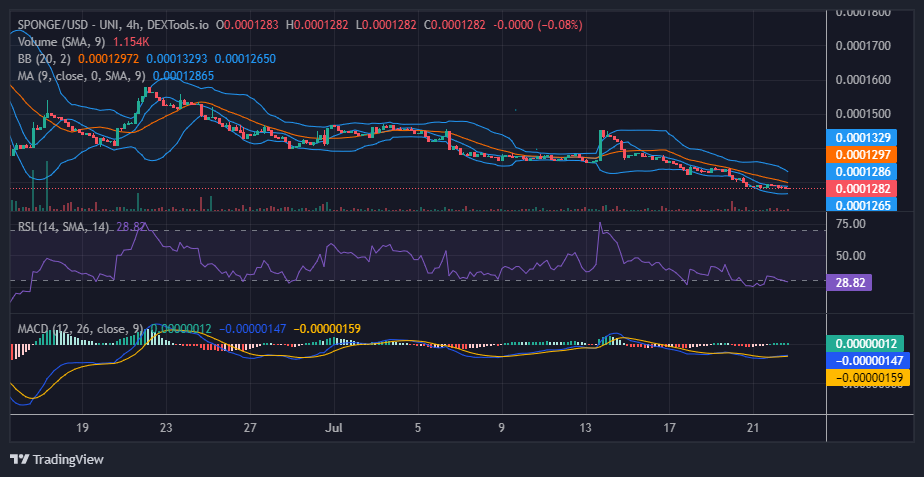
The selling pressure has forced the $SPONGE market into the $0.00013 price zone. The presence of the bulls in the market can be felt as buyers held to the demand level, preventing a steep price decline. In the $0.00013 price zone, a bullish price rush can be triggered.
Key Levels
- Resistance: $0.0004, $0.0045, and $0.0005.
- Support: $0.00013, $0.00012, and $0.00011
SPONGE/USD ($SPONGE) Price Analysis: The Indicators’ Point of View
In the Relative Strength Index, we notice the $SPONGE market oscillating within a narrow range along the edge of the oversold level, which is level 30. As traders may consider the market oversold, we can begin to witness a growing bullish sentiment in the market. For now, bulls are holding their ground at $0.0001282, and the ongoing consolidation may strengthen the support level to form the basis for more bullish price advancement.
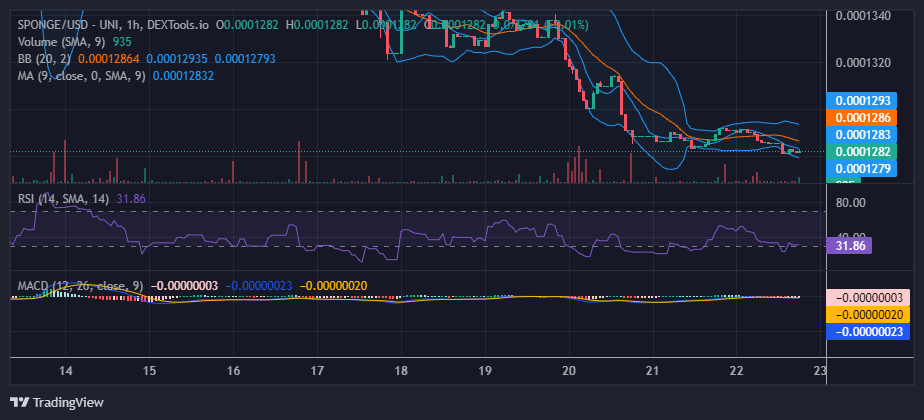
SPONGE/USD Short-Term Outlook: 1-Hour Chart
From the 1-hour chart outlook on the market, we can observe the growth of investors’ interest. The market volume indicator is beginning to show signs of an increase in trading activities. However, the Bollinger Bands are converging, indicating a volatility squeeze and suggesting that a decisive market movement is imminent. Additionally, since the market is at the edge of the oversold territory, the breakout is likely to be in the upward direction.
Don’t miss the SPONGE airdrop!
🌊Hey #SPONGERS!🗣️
🧽The exciting $SPONGE #Airdrop awaits you!🚀🎁
🌊Make sure to meet the requirements on our #Discord for eligibility!✅
🧽Check out the airdrop-registration guidelines for all the details!📝💰
🔗https://t.co/lzRhjW4oLL pic.twitter.com/W3h1JmMZeT
— $SPONGE (@spongeoneth) July 22, 2023
Invest in the hottest and best meme coin. Buy Sponge ($SPONGE) today!