SPONGE/USD ($SPONGE) Technical Outlook: Bulls Eyeing a Possible Recovery
Estimated Reading Time: 2 minutes
Don’t invest unless you’re prepared to lose all the money you invest. This is a high-risk investment and you are unlikely to be protected if something goes wrong. Take 2 minutes to learn more

After hitting resistance near the $0.000088 zone, $SPONGE came under strong bearish pressure, forcing the market below the $0.000080 support. Buyers attempted to defend this level but were unable to sustain momentum, opening the door for further downside. Although the price once looked set to challenge the $0.000090 barrier, the rally stalled before reaching it, sparking an extended struggle between bulls and bears.
By September 8, sellers tightened their grip, dragging the price lower. Currently, bulls are regrouping around the $0.000078 level, which may serve as a platform for a possible rebound.
Critical Levels to Watch
- Resistance: $0.000115, $0.000120, $0.000130
- Support: $0.000075, $0.000070, $0.000065
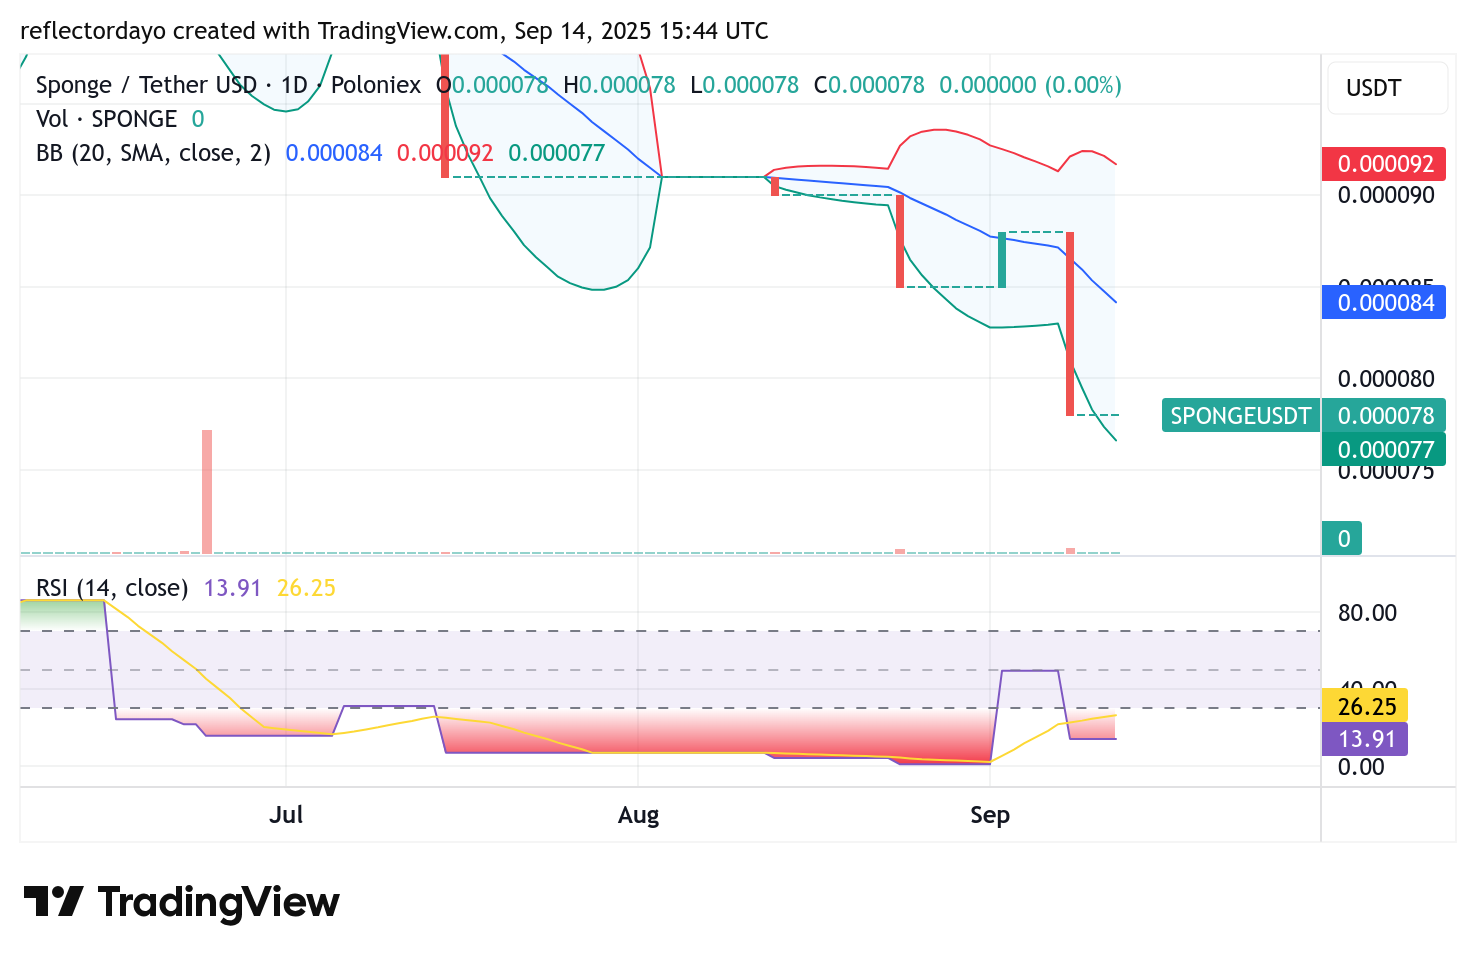
SPONGE/USD Daily Chart: Oversold Conditions Point to Recovery Risk
Technical indicators suggest the bearish momentum could be fading. The RSI has dropped into deep oversold territory near 13, while the Bollinger Bands show price trading well below its median line. This combination implies that the market may currently be undervalued, raising the likelihood of a corrective upswing in the $SPONGE market.
Historically, such conditions tend to attract dip buyers who position early for a possible reversal.
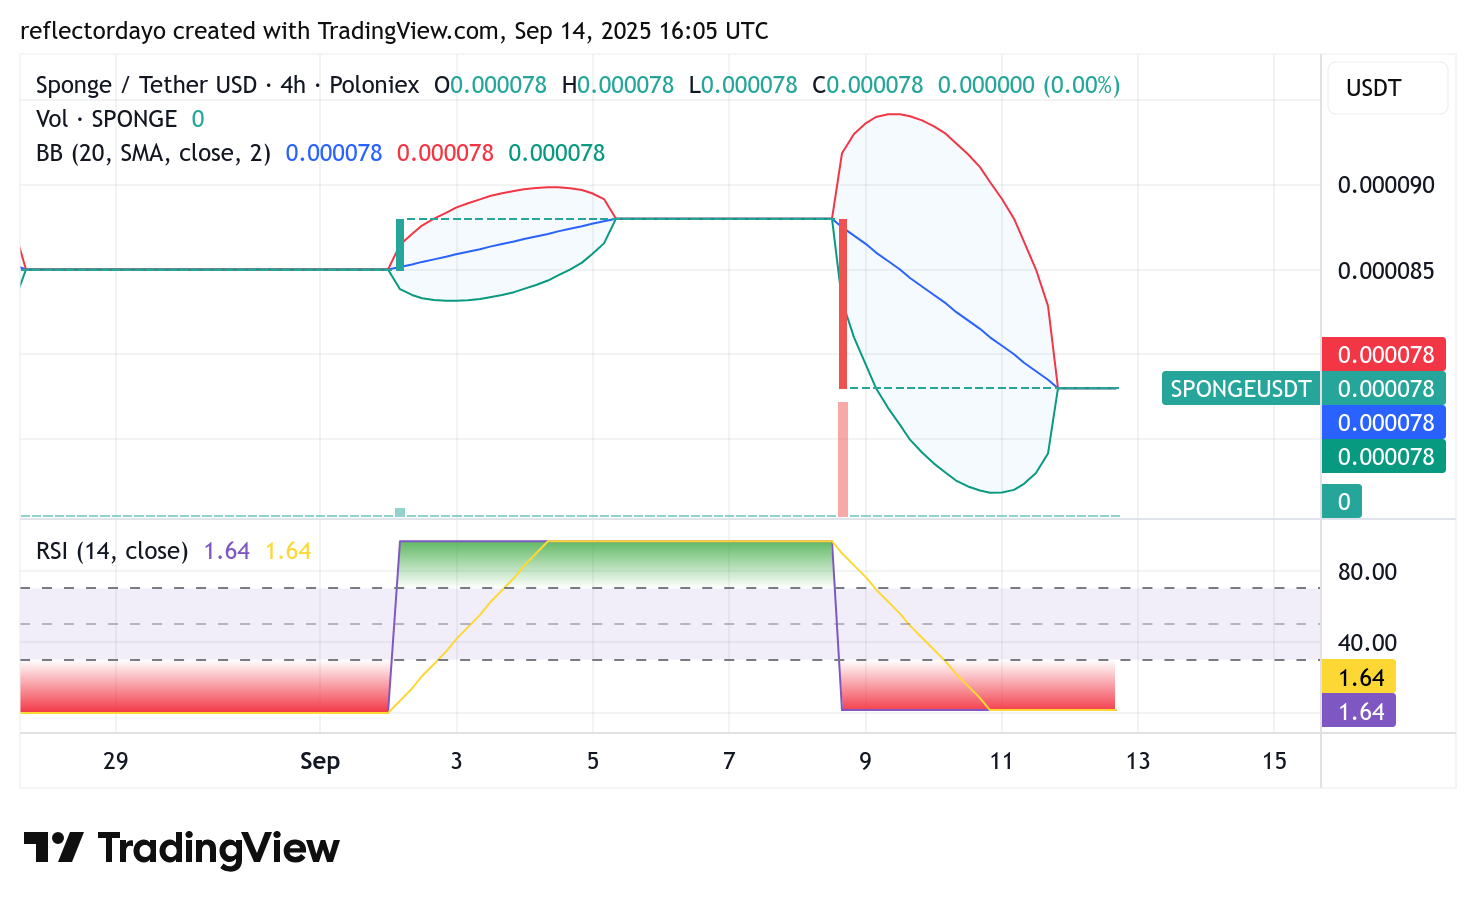
$SPONGE 4-Hour Chart: Consolidation Phase Could Spark Breakout
On lower timeframes, $SPONGE is locked in a tight range near $0.000078, hinting at indecision in the market. The narrowing of Bollinger Bands signals a volatility squeeze, a setup that often precedes a sharp directional move.
Should bulls manage to inject fresh volume, momentum could quickly flip upward, setting the stage for a strong recovery. The current structure leans toward a bullish breakout, though confirmation will depend on sustained buying interest.
Buy SPONGE/USD!
The average memecoin trader: pic.twitter.com/vyrAD46wot
— $SPONGE (@spongeoneth) September 9, 2025
Join the SPONGE community and get in on the next big crypto opportunity! Buy Sponge ($SPONGE) today