Starknet (STRK/USD): Bullish Momentum Breaks Consolidation
Estimated Reading Time: 3 minutes
Don’t invest unless you’re prepared to lose all the money you invest. This is a high-risk investment and you are unlikely to be protected if something goes wrong. Take 2 minutes to learn more

Throughout September, the Starknet market experienced several bursts of investor interest. However, these short-lived surges failed to translate into meaningful upside, keeping price action largely confined within a consolidation channel.
Today’s session tells a different story. A strong wave of bullish sentiment has finally translated into upward momentum, breaking the recent pattern of stagnation. At present, the market is testing resistance around the $0.142 level, a key zone that could determine whether this rally has the strength to extend further.
Starknet (STRK/USD) Market Data
- STRK/USD Price Now: $0.141
- STRK/USD Market Cap: $562 million
- STRK/USD Circulating Supply: 4 billion
- STRK/USD Total Supply: 10 billion
- STRK/USD CoinMarketCap Ranking: #117
Key Levels to Watch
- Resistance: $0.150, $0.160, $0.165
- Support: $0.120, $0.115, $0.110
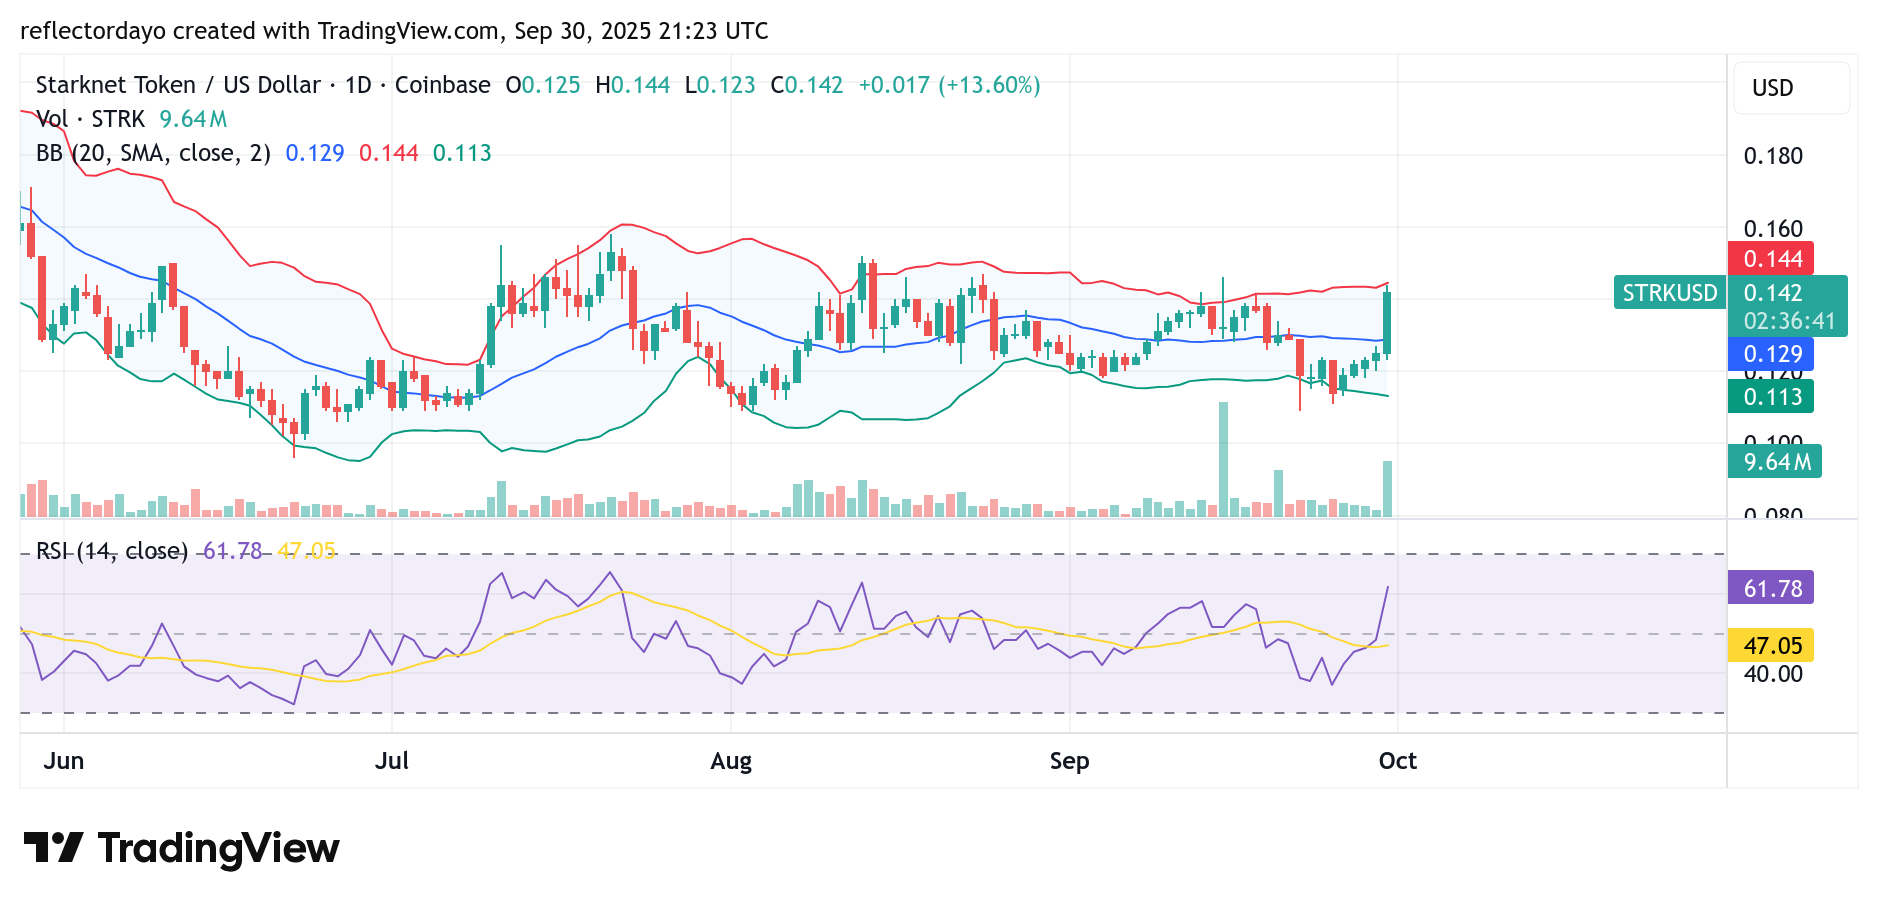
Starknet (STRK/USD) Daily Chart Outlook
The Bollinger Bands highlight how Starknet’s price action has largely remained in a horizontal consolidation pattern, with price oscillating between the $0.120 and $0.140 levels. While this range has kept the market direction neutral, today’s trading session has introduced a notable shift.
The market has shown a consistent bullish trend throughout the day, driving the crypto signal back toward the $0.140 threshold. As price approached this resistance, traders displayed caution; however, the current candlestick remains firmly bullish, backed by higher trading volume. This signals strong buyer dominance in the market.
The key focus for traders and analysts now is whether price can sustain a break above $0.140. A decisive move beyond this level would mark the beginning of a potential upside breakout and open the door for further bullish momentum.
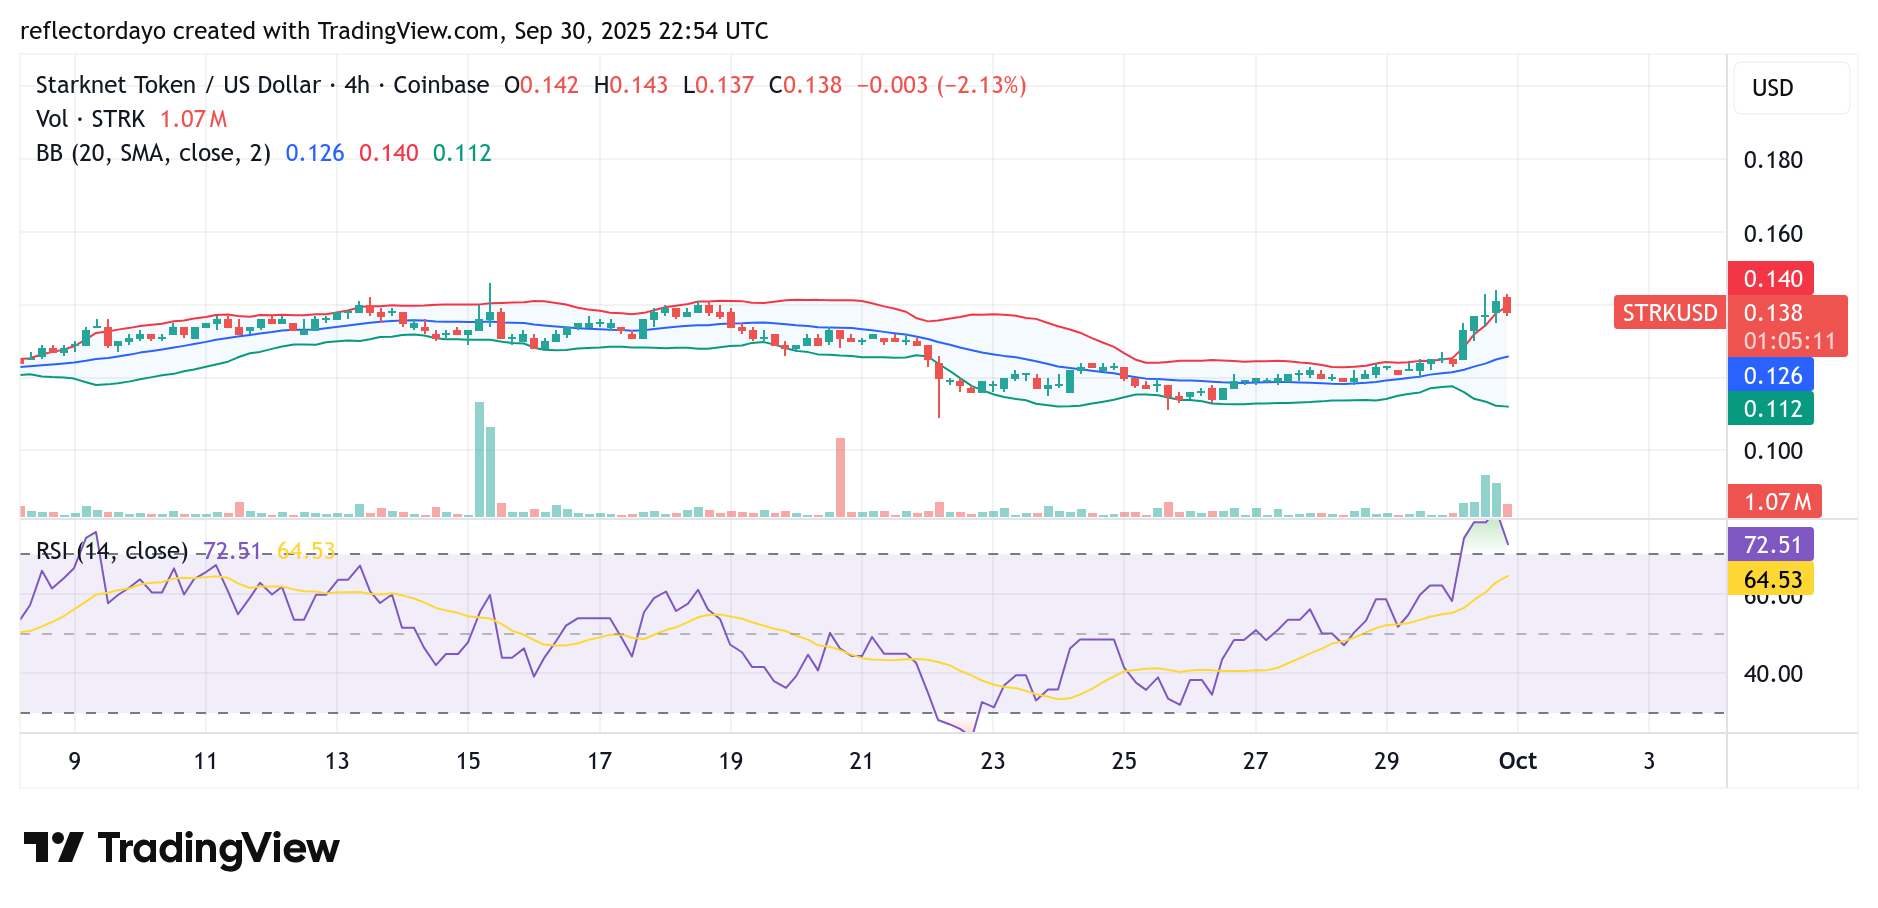
STRK/USD 4-Hour Chart Outlook
On the 4-hour timeframe, Starknet appears to be struggling to hold above the $0.140 level. The Relative Strength Index (RSI) indicates that the market is currently in overbought territory, signaling the potential for a corrective move.
Despite this warning, price action shows that the bulls are actively defending the $0.140 support zone, rejecting bearish pressure at this level. This tug-of-war between RSI signals and price behavior suggests heightened market tension.
If the bulls maintain control, a sustained move above $0.140 could reinforce the bullish outlook. However, a breakdown below this level may validate the RSI warning and trigger a deeper retracement, potentially driving price toward the $0.126 support area.