Starknet (STRK/USD) Price Action Shifts Above $0.15
Estimated Reading Time: 3 minutes
Don’t invest unless you’re prepared to lose all the money you invest. This is a high-risk investment and you are unlikely to be protected if something goes wrong. Take 2 minutes to learn more

As volatility returns to the Starknet market, renewed buying activity has propelled the price to break out of its consolidation phase below the $0.15 level and move above it. This breakout has strengthened bullish sentiment among traders, adding momentum to the market’s advance toward the key $0.20 resistance level. However, signs of exhaustion are beginning to emerge, suggesting that the bullish drive may soon face resistance from profit-taking or renewed selling pressure.
Starknet (STRK/USD) Market Data
- STRK/USD Price Now: $0.194
- STRK/USD Market Capitalization: 882 million
- STRK/USD Circulating Supply: 4.6 billion STRK
- STRK/USD Total Supply: 10 billion STRK
- STRK/USD CoinMarketCap Ranking: #78
Key Levels to Watch
- Resistance: $0.25, $0.30, $0.35
- Support: $0.15, $0.14, $0.13
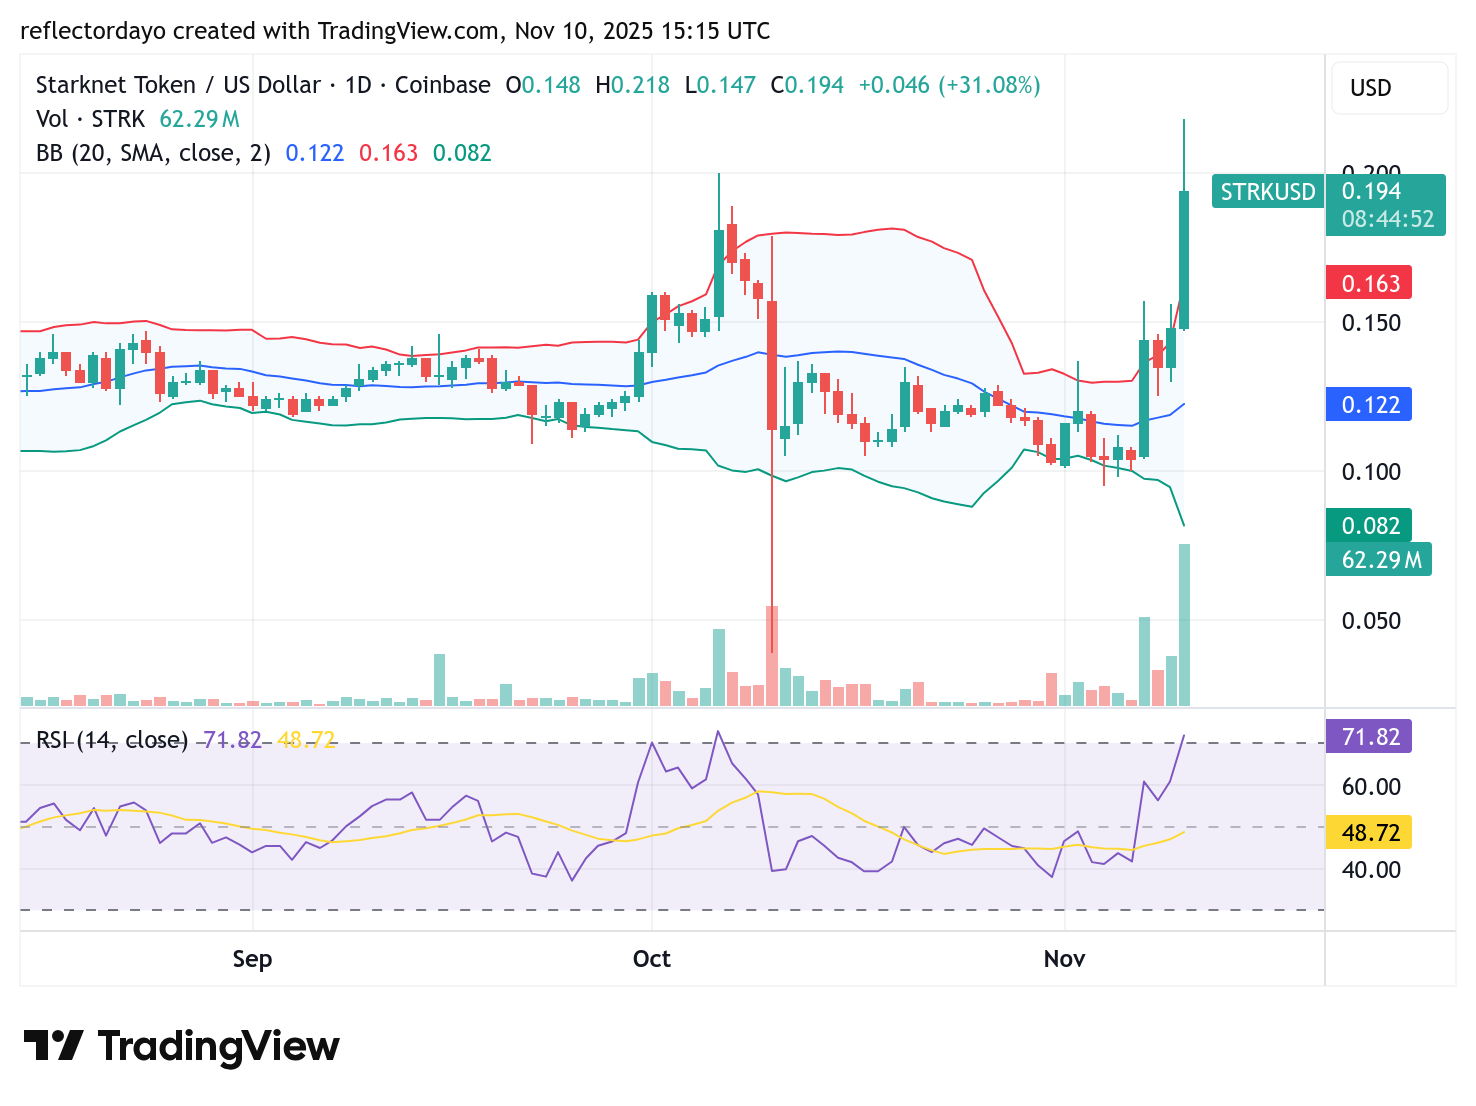
Starknet (STRK/USD) Daily Chart
Following the recent bullish price movement in the Starknet market, the widening of the Bollinger Bands suggests rising volatility — a sign that a potential price correction may be approaching. Given the strength of the ongoing upward momentum, the $0.15 level is likely to serve as a higher support zone, helping to sustain the market’s bullish structure.
Considering that the price of Starknet reached a high of $0.20 in early October, this area now stands as a significant resistance level. The shift in these key zones highlights the progress of the bulls in reclaiming control of the market. However, with both levels showing notable trading activity, a consolidation phase within this price channel may persist in the near term as the market gathers strength for its next major move.
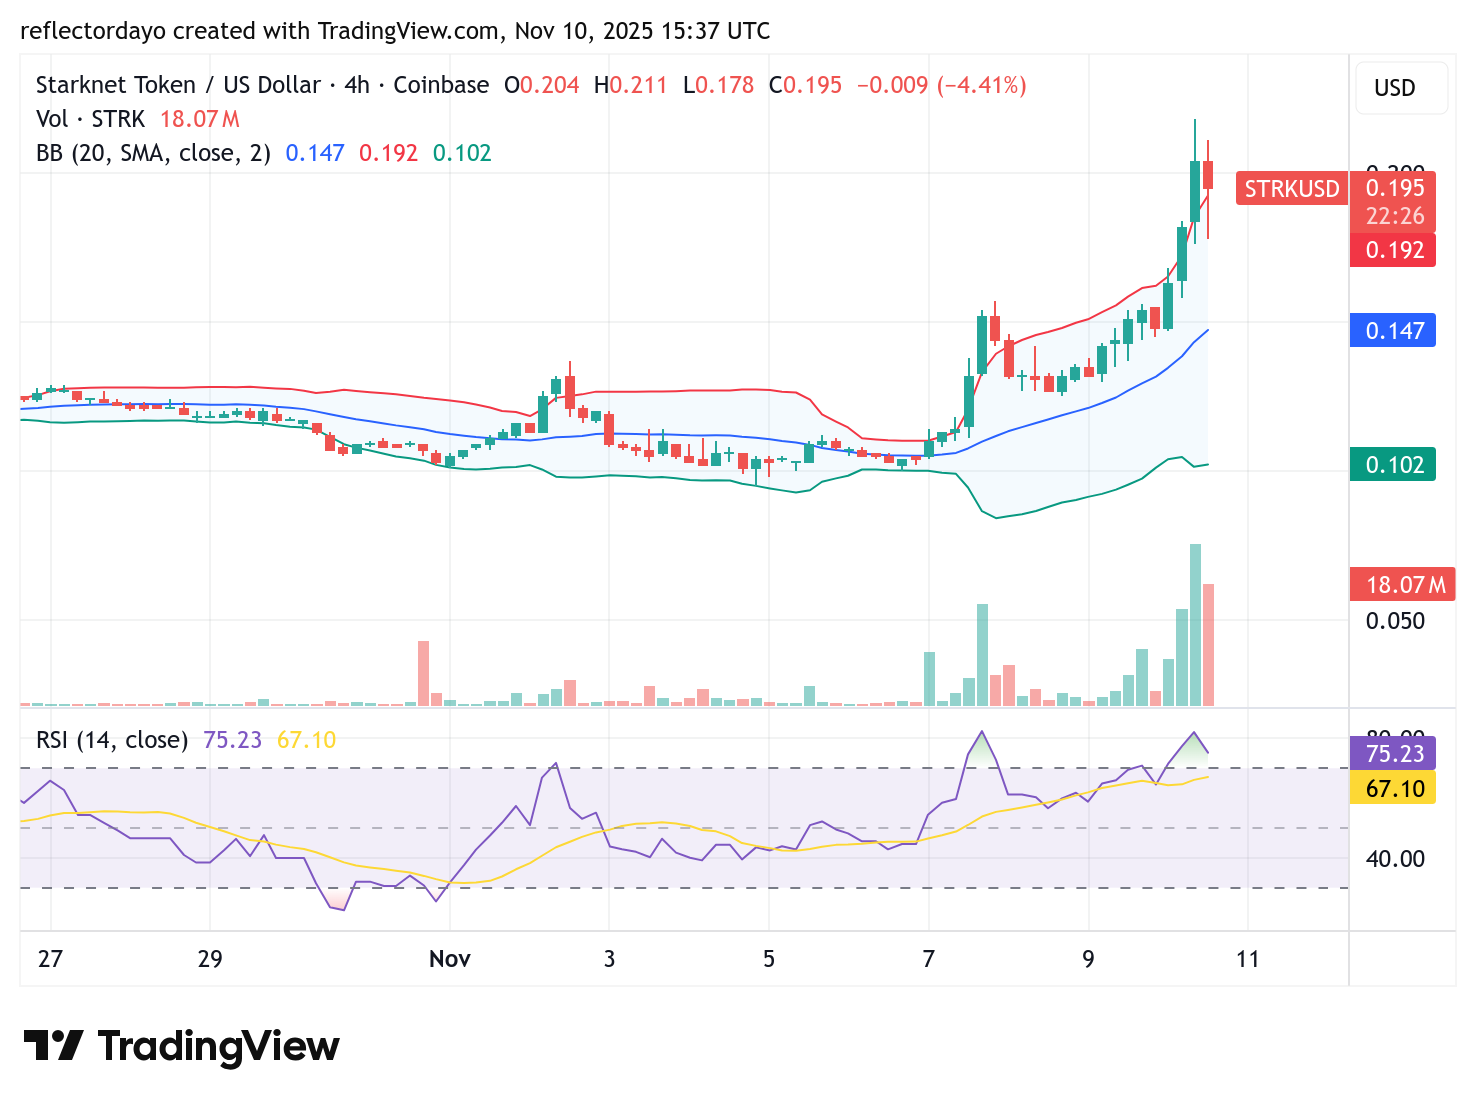
STRK/USD 4-Hour Chart Outlook
From the 4-hour chart perspective, the strength of the bulls remains evident. Over the past few trading sessions, the market has maintained steady upward momentum. After reaching the $0.20 level, a mild correction emerged — likely driven by profit-taking — yet the bearish activity appears insufficient to push the price back toward the $0.15 support zone.
It is important to note, however, that the market currently shows signs of being overbought, as indicated by both the RSI and the upper stretch of the Bollinger Bands. This suggests that a short-term correction could be imminent. Nevertheless, if bullish momentum persists, a breakout above the $0.20 resistance could occur, potentially inviting stronger buying interest and extending the upward move.