Stellar Lumens (XLMUSD) Holds Above Range Floor as Price Compresses Near Mid-Zone
Estimated Reading Time: 3 minutes
Don’t invest unless you’re prepared to lose all the money you invest. This is a high-risk investment and you are unlikely to be protected if something goes wrong. Take 2 minutes to learn more

XLMUSD Price Prediction — January 16
Stellar Lumens (XLMUSD) is trading around the $0.228 region after stabilizing above its recent support base. Following the earlier pullback, price action has shifted into a tight consolidation, with volatility compressing and momentum flattening. Current structure reflects balance rather than direction, as both buyers and sellers hesitate ahead of the next decisive move.
XLMUSD Market Key Levels
Resistance levels: $0.265, $0.354
Support levels: $0.219, $0.196

XLMUSD Long-Term Trend — Neutral (Daily Chart)
On the daily chart, XLMUSD remains locked in a broader consolidation structure rather than a trending phase. The market continues to respect the $0.219 support zone, which has acted as a reliable floor during recent pullbacks. At the same time, upside progress remains capped below the $0.265 resistance area, keeping price trapped within a defined range.
My Technical Analysis Chart Art on $xlmusd setting up and executing for our next trade. pic.twitter.com/yOvednvNxg
— AwakenSoul🖤🪽👑✨🫶🏼 (@awakensoulslove) January 16, 2025
What is the market outlook for XLMUSD?
Momentum indicators reflect hesitation. Bullish pressure is present but weak, suggesting accumulation rather than aggressive expansion. Candlestick structure also shows reduced range, reinforcing the idea that the market is waiting for confirmation before committing to a directional move.
As long as XLMUSD holds above $0.219, the broader structure favors stability and gradual base building. A clean breakout and daily acceptance above $0.265 would signal renewed bullish intent and open the path toward the higher resistance near $0.354. Such a move would indicate that consolidation is resolving to the upside, aligning with improving crypto signals across select altcoins.
On the downside, failure to maintain support at $0.219 would shift focus toward $0.196, where buyers must defend to prevent a deeper structural breakdown. Until either boundary is breached, price action is likely to remain rotational and range-bound.
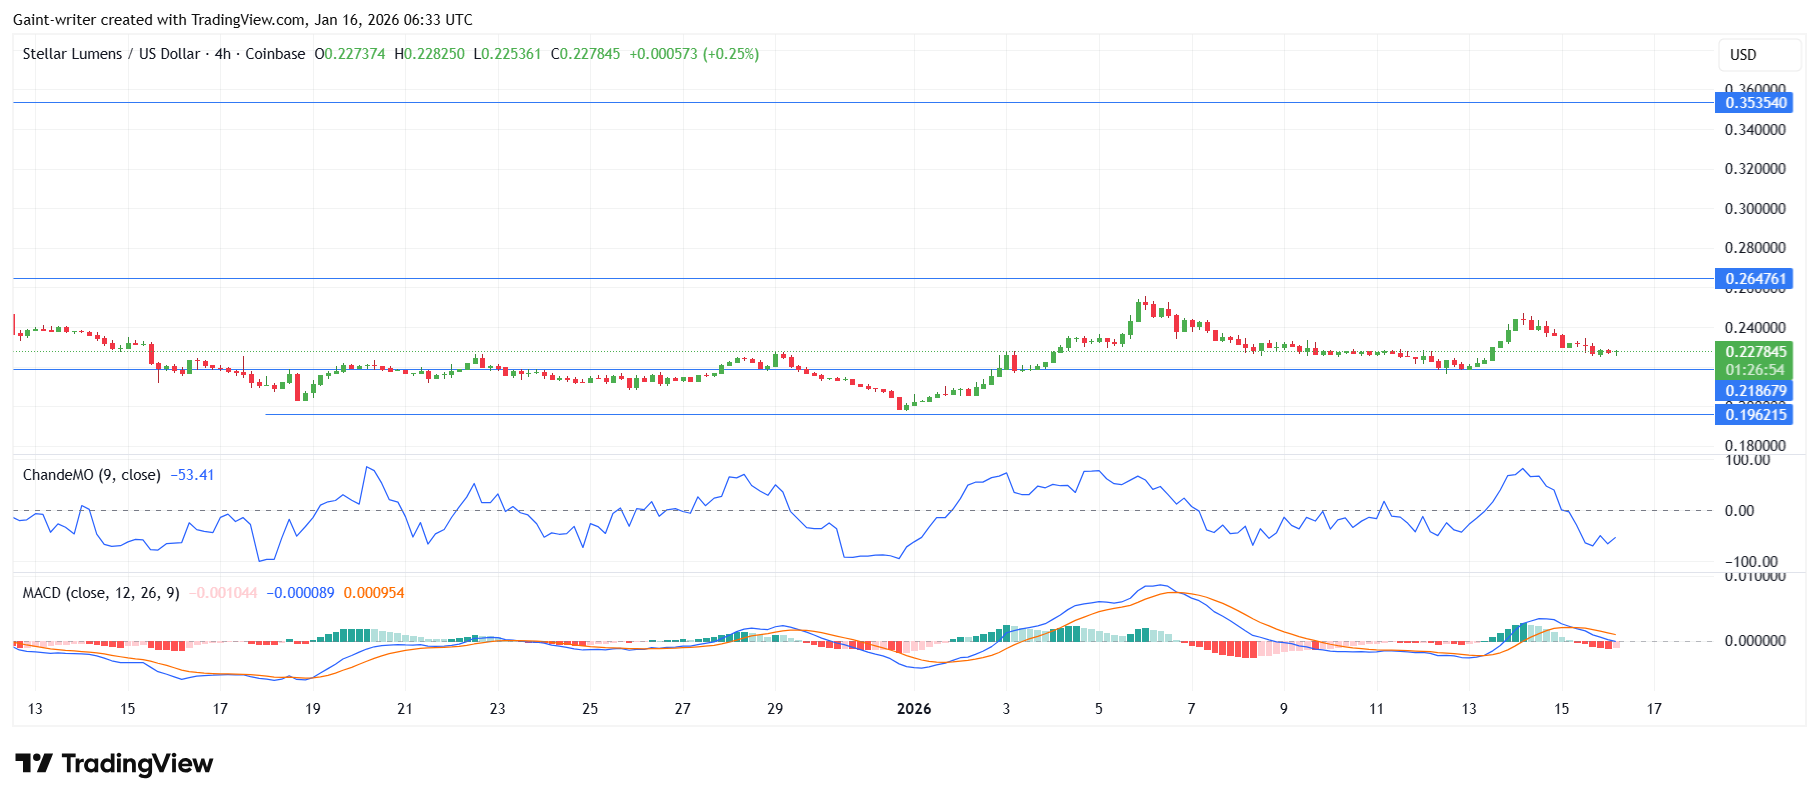
XLMUSD Short-Term Trend — Neutral (4-Hour Chart)
On the 4-hour chart, XLMUSD continues to trade in a compressed range, rotating around the mid-zone with shallow swings and limited follow-through. Volatility has tightened significantly, a condition that often precedes expansion.
Short-term structure suggests patience is warranted. A decisive push above the $0.230–$0.235 area would increase the probability of a move toward $0.265, while a breakdown below $0.219 would likely trigger a sweep toward lower support. Until then, the market remains balanced, favoring reactive rather than predictive positioning.
XLMUSD Market Statistics
Current Price: $0.23
Market Capitalization: $6,000,000,000
24H Trading Volume: $300,000,000
You can purchase Stellar here. Buy XLM