Tamadoge (TAMA): Poised for Breakout After Consolidation Phase
Estimated Reading Time: 3 minutes
Don’t invest unless you’re prepared to lose all the money you invest. This is a high-risk investment and you are unlikely to be protected if something goes wrong. Take 2 minutes to learn more
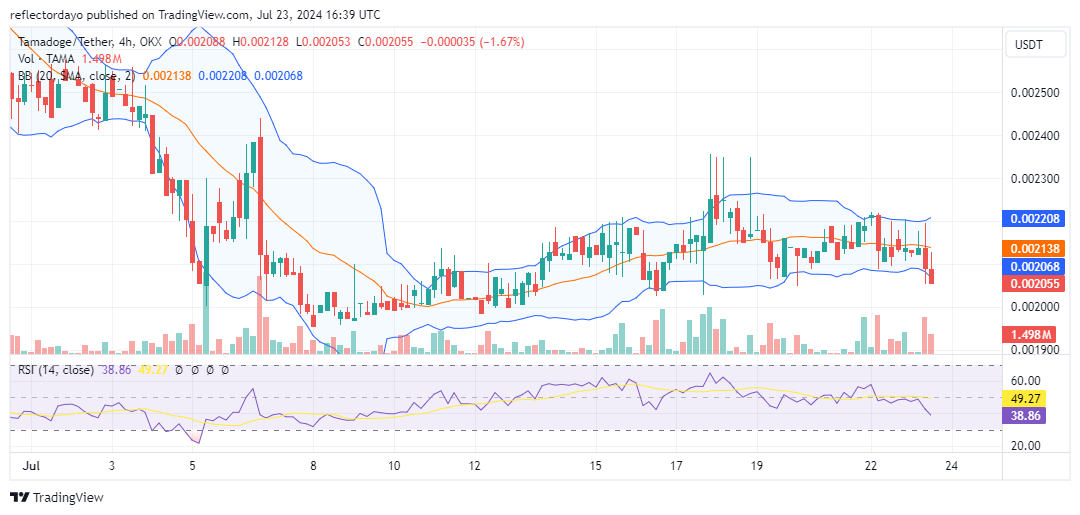
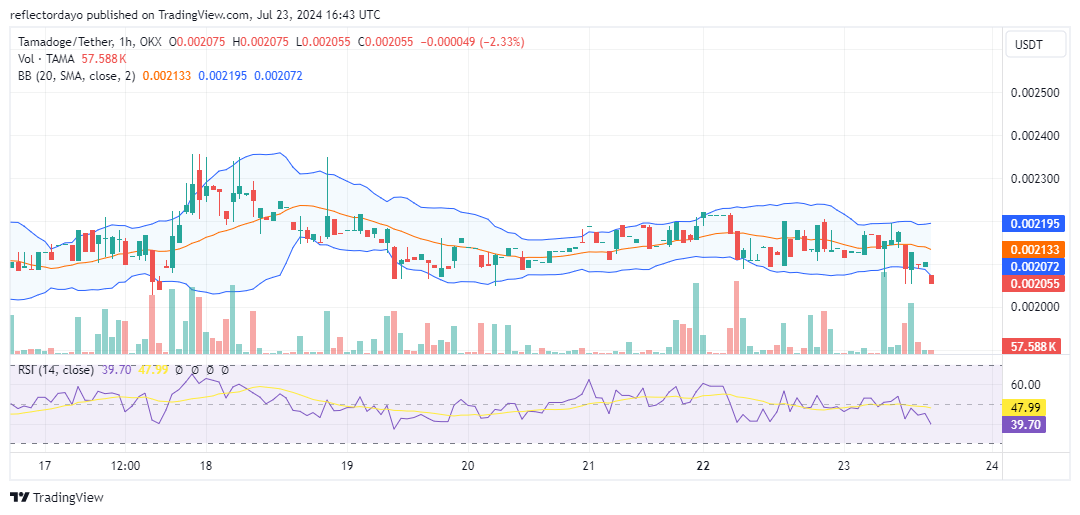
The Tamadoge market has settled into a consolidation trend between the $0.0022 and $0.002 price levels as market volatility increases. The rising volatility is a result of the ongoing downward market action. Bearish pressure is pushing the market into bullish territory, potentially attracting more traders interested in buying the dip. The market may bounce once it reaches the $0.00204 price level, which is the next support level.
Key Levels
- Resistance: $0.013, $0.014, and $0.015
- Support: $0.0020, $0.0019, and $0.0018
TAMA/USD Price Analysis: The Indicators’ Point of View
Initially, we observed that the RSI line was moving around the 50 level, indicating market equilibrium. This means that the $0.0021 price level was the equilibrium price. There was a struggle for market dominance at this level until the bears gained the upper hand and pushed the price down towards the support level at $0.00204.
However, this significant bearish move has not changed the overall market direction, which remains a sideways ranging trend. The market’s next direction will be determined by what happens at the $0.00204 price level, whether it results in a breakdown or a breakout. Given the growing market volatility due to the current bearish movement, bulls may capitalize on this crypto signal to rally the price.
Tamadoge Short-Term Outlook: 1-Hour Chart
The market on the 1-hour chart outlook is quite similar to its appearance on the 4-hour chart. An interesting observation is that as the bearish market approaches the key support level, the volume of trade indicator shows a decline in trading activity. The small histogram representing the last trading session indicates that the bears are losing strength and may not be able to push the price further down. Therefore, traders should expect the market to bounce from this level.
Cool Characters: Unique pets with diverse traits! Gameplay IQ: Traits such as intelligence and agility enhance your score and earn you more $TAMA.
Let’s talk NFTs in #Tamadoge 🐶
🐕 Cool Characters: Unique pets with varied traits!
🏆 Gameplay IQ: Traits like intelligence and agility boost your score higher and will earn you more $TAMA.
🔄 Trade & Collect: Trade your #NFT on the marketplace to collect rare pets.#Crypto pic.twitter.com/PCNHAfXcmi
— TAMADOGE (@Tamadogecoin) July 22, 2024