Tamadoge (TAMA/USD) Awaits Bullish Momentum at $0.007
Estimated Reading Time: 3 minutes
Don’t invest unless you’re prepared to lose all the money you invest. This is a high-risk investment and you are unlikely to be protected if something goes wrong. Take 2 minutes to learn more

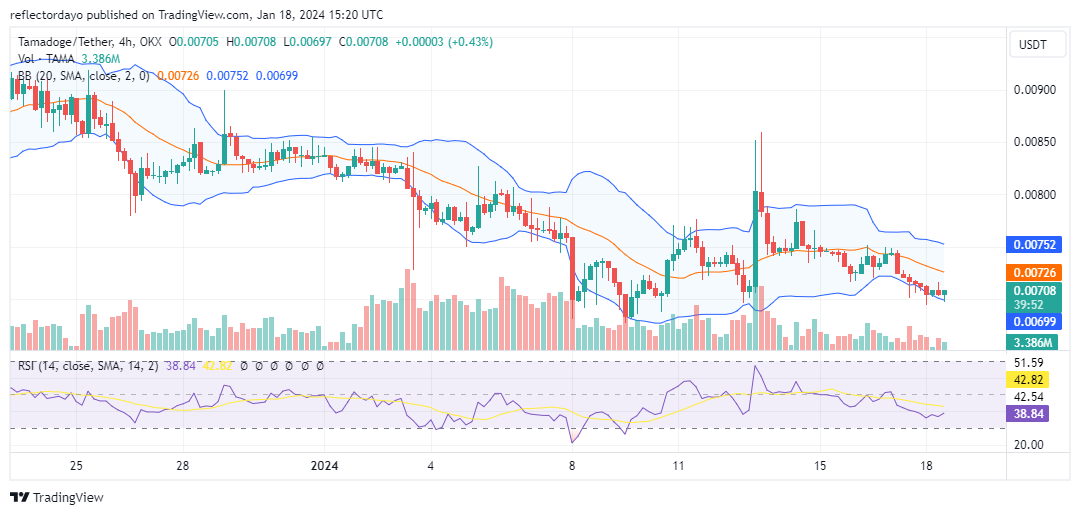
Initially, a TAMA/USD bullish intervention was anticipated to unfold around the $0.0075 price level as bulls and bears became entangled in a price gridlock around this point. Contrary to expectations, the bears gained the upper hand, causing the market to decline towards the $0.0070 price level. Historically, this price level has proven to be a robust support for bullish trends, often halting several bearish market movements.
Given the historical significance of this level, there is a likelihood that the ongoing ranging bear market may not extend beyond this point, emphasizing the potential resilience of the $0.0070 support level in curbing further bearish momentum.
Key Levels
- Resistance: $0.013, $0.014, and $0.015.
- Support: $0.0070, $0.0068, and $0.0064.
TAMA/USD Price Analysis: The Indicators’ Point of View
The TAMA/USD bears have made numerous attempts to drive the market below $0.007, but these efforts have consistently been unsuccessful. This suggests a prevailing bullish sentiment among traders in this area, making it unlikely for the market to decline below this threshold. Candlesticks around the $0.007 price level are already exhibiting bullish signals.
Despite the bearish indications from both the Bollinger Bands indicator and the Relative Strength Index (RSI), a bullish recovery is currently underway. The RSI line is undergoing a shift from a bearish trajectory to a bullish one, indicating a potential reversal in market sentiment.
Tamadoge Short-Term Outlook: 1-Hour Chart
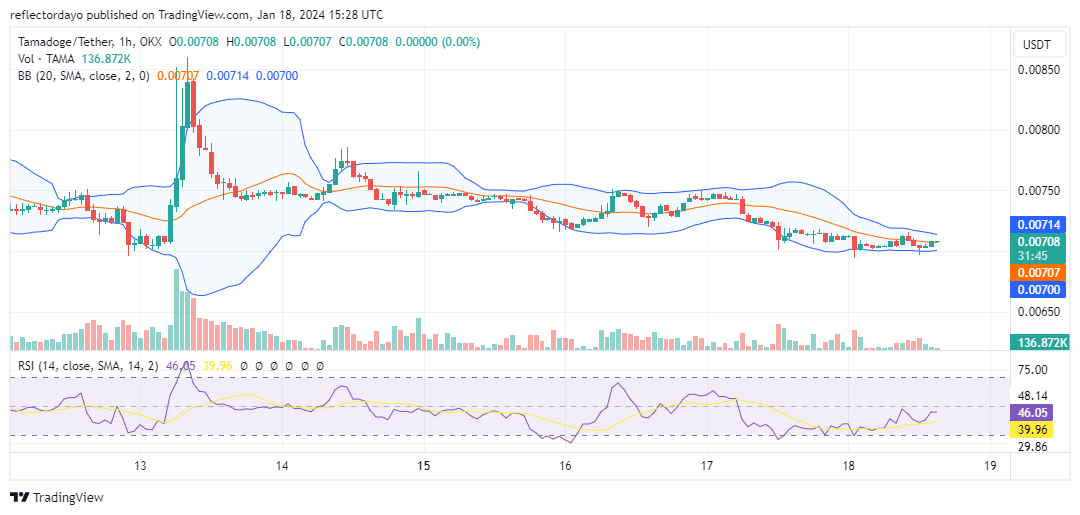
From this perspective, the Bollinger Bands are currently converging, signaling a peak in the standoff between demand and supply. The reduction in investor interest is contributing to a decrease in volatility, as reflected in the declining histograms of the volume of trade indicator. Anticipated is a forthcoming resumption of the market’s upward trajectory.
It is widely recognized that the opportune time to buy is when the market reaches its lowest point in a trend. As such, investors may find strategic entry points during periods of reduced volatility and converging Bollinger Bands.
Enter the world of Tamadoge games and see how much money you can make with $TAMA!
Dive into the world of Tamadoge games and watch your $TAMA earnings grow!
Play, earn, stake, and repeat for an endless cycle of excitement and rewards 🎉
Check out all of our games on mobile now 👇
📱 Android: https://t.co/D4TjX7gTFl
📱 iOS: https://t.co/0fjJapf5oA pic.twitter.com/7QrRJ2V98s— TAMADOGE (@Tamadogecoin) January 16, 2024
Do you want a coin that will be 100 times more valuable in the next few months? That is Tamadoge. Buy TAMA today!