Tamadoge (TAMA/USD) Bullish Sentiment Still Lingers In the Market
Estimated Reading Time: 3 minutes
Don’t invest unless you’re prepared to lose all the money you invest. This is a high-risk investment and you are unlikely to be protected if something goes wrong. Take 2 minutes to learn more
Bullish sentiment persists in the Tamadoge market as buyers regroup, attempting to gain momentum around the $0.00071 support level. However, the recovery failed to break past the $0.00075 resistance, as lingering bearish pressure forced the price back to the key $0.00071 level.
A closer look at the price action reveals that the market has flattened at this level, suggesting that bearish momentum may be weakening. This indicates that sellers might not have enough strength to push the price further below the critical $0.00071 support.
Key Levels
- Resistance: $0.0010, $0.0011, and $0.0012
- Support: $0.0007, $0.00065 and $0.0006
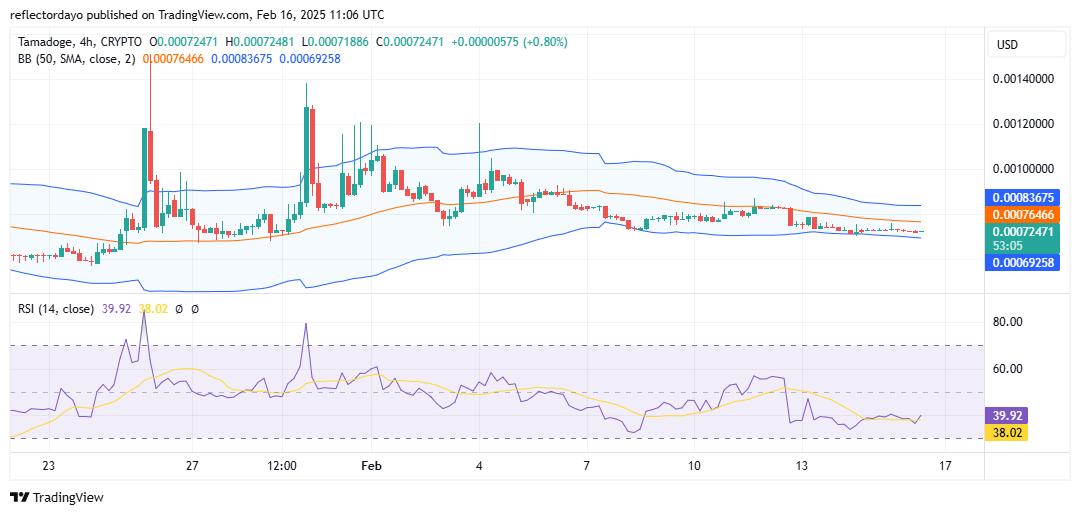
TAMA/USD Price Analysis: The Indicators’ Point of View
During the last analysis of the Tamadoge market, price action remained nearly flat around the $0.0008 level before sellers regained control, driving the price down to approximately $0.00071. The price channel has since tightened, with bullish sentiment concentrated around $0.0007 and bearish pressure at $0.0008, signaling growing crypto market indecision.
This indecisiveness is further reflected in the Bollinger Bands, which have narrowed, indicating a volatility squeeze. Such a squeeze often precedes a breakout, suggesting that some investors may be accumulating assets in anticipation of a potential price surge in the near future.
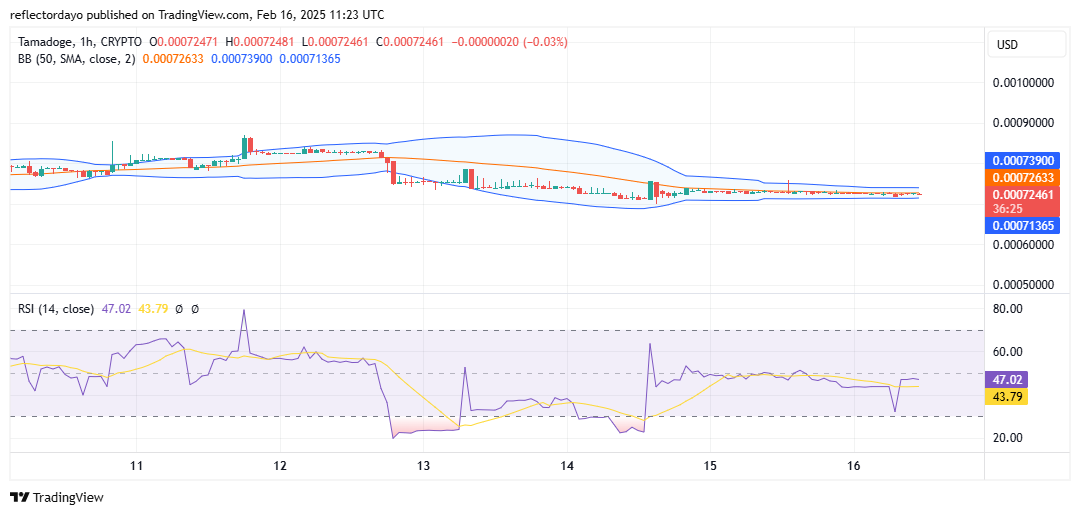
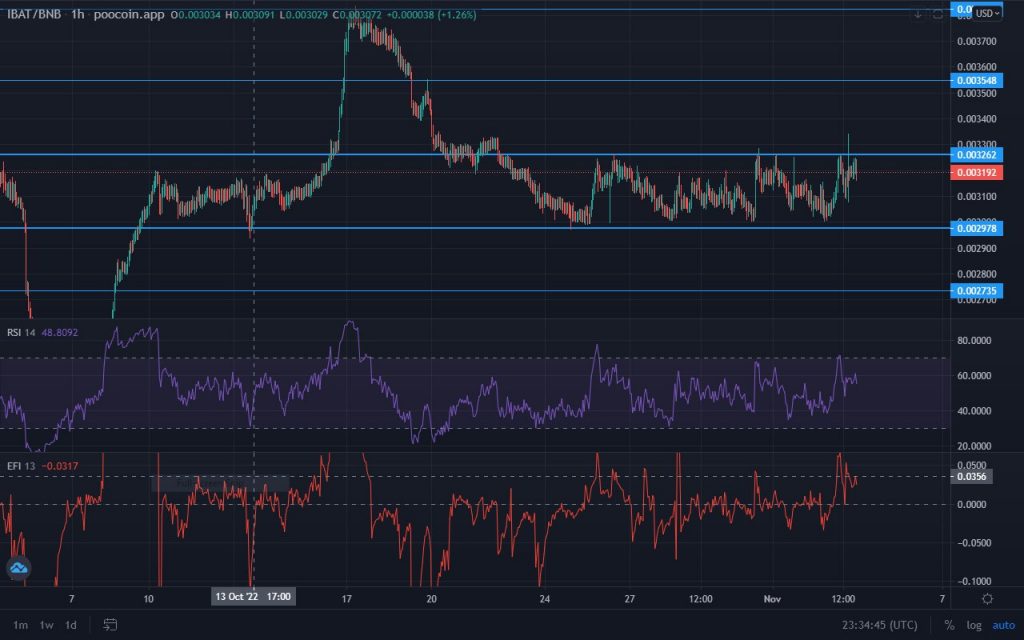
Tamadoge Short-Term Outlook: 1-Hour Chart
Zooming into the 1-hour chart, we observe the price moving sideways along a horizontally aligned moving average. Over time, candlestick formations have consistently displayed doji patterns, aligning closely with the moving average.
Additionally, the Bollinger Bands have converged around the narrow price channel, indicating the possibility of an imminent breakout or price bounce. If bullish momentum strengthens, the price could potentially rise toward the $0.001 level.
Buy TAMA/USD!
There’s no mobile runner out there quite like #TamadogePursuit! 🏃♂️
1️⃣ Sign up – start with 20 free credits for a boost!
2️⃣ Climb up the leaderboards.
3️⃣ Win $TAMA rewards!Play Now! 👇
📱Android: https://t.co/Of8SYALRzL
📱 iOS: https://t.co/IthvqovwAH pic.twitter.com/84HNqob9Rf— TAMADOGE (@Tamadogecoin) September 10, 2024