Tamadoge (TAMA/USD) Bulls Maintain Control of Market Dynamics
Estimated Reading Time: 3 minutes
Don’t invest unless you’re prepared to lose all the money you invest. This is a high-risk investment and you are unlikely to be protected if something goes wrong. Take 2 minutes to learn more
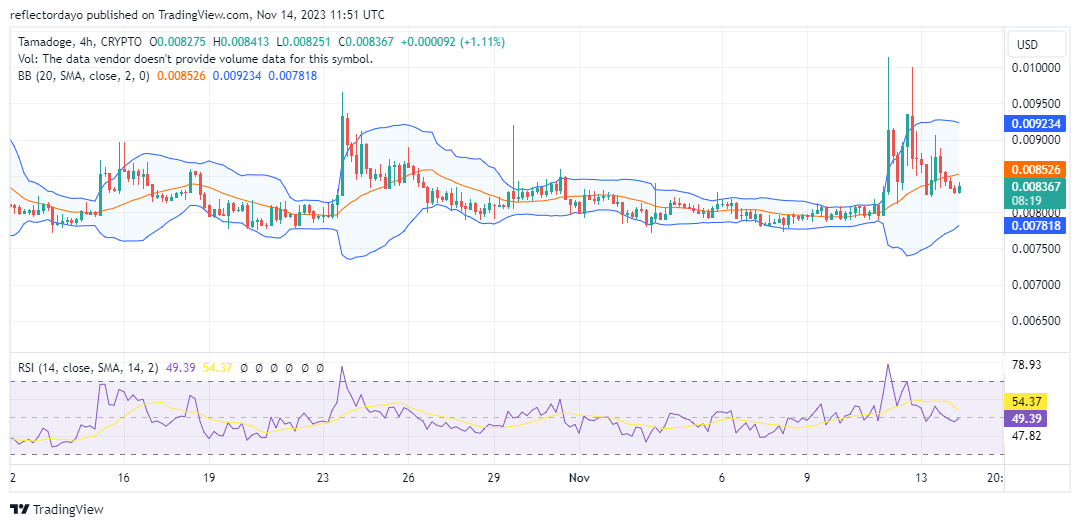
Recently, specifically on November 11, the TAMA/USD market experienced a surge in liquidity, impacting both the bullish and bearish segments. Consequently, significant volatility has been observed in the market. The bullish momentum propelled the market to reach a high of $0.010, contributing to an increase in volatility. Subsequently, at the $0.010 level, the bear market also witnessed a rise in liquidity, leading to substantial oscillations in the price. Currently, the price oscillates around the $0.0085 level, with a notable prevalence of upward swings compared to downward movements.
Key Levels
- Resistance: $0.013, $0.014, and $0.015.
- Support: $0.0075, $0.0073, and $0.007.
TAMA/USD Price Analysis: The Indicators’ Point of View
The current market conditions indicate a decrease in volatility, raising the likelihood of TAMA/USD price consolidation around the $0.008 level. With a predominance of upward swings over downward movements, it suggests a prevailing dominance of bulls over bears in this market, potentially sustaining an upward trend. The anticipated next phase in market dynamics could involve consolidation around the $0.0085 price level, supported by the current positioning of the Relative Strength Index around level 50. The current market momentum is positioned at level 50, and the consolidation aims to establish a higher low at the $0.0085 price level.

Tamadoge Short-Term Outlook: 1-Hour Chart
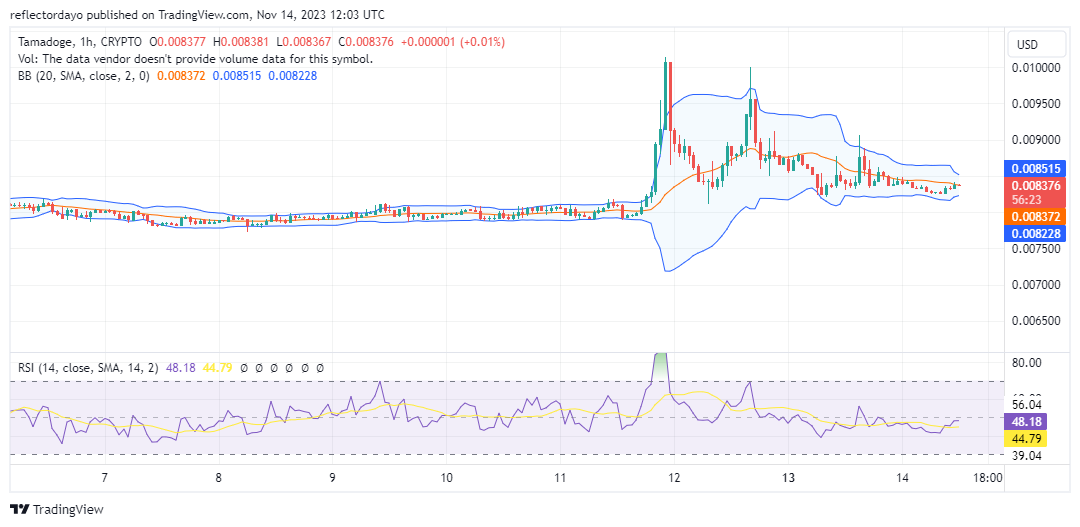
In a shorter-term market analysis, the price is currently consolidating near the $0.0085 level, with the Bollinger Bands indicator forming a narrow band around this range. This suggests an impending shift in market direction. The prevailing indication leans towards an upward movement, considering the evident dominance of the bull market in this particular market scenario.
Are you up for an amazing journey? It’s Super Doge time!
🚀 Ready for an epic adventure? Super Doge is here! 🐕
Collect magnets, shields, and extra lives in-game to dominate the leaderboards. The higher you score, the more $TAMA you earn!
Download now 👉
📱 Android: https://t.co/3PXpfUAM0J
📱 iOS: https://t.co/UN5MlRGh44 pic.twitter.com/PG0mannCRA— TAMADOGE (@Tamadogecoin) November 14, 2023
Do you want a coin that will be 100 times more valuable in the next few months? That is Tamadoge. Buy TAMA today!